Comparative Study
. 1999 May;113(5):661-78.
doi: 10.1085/jgp.113.5.661.

Four kinetically distinct depolarization-activated K+ currents in adult mouse ventricular myocytes

Affiliations
Comparative Study

Four kinetically distinct depolarization-activated K+ currents in adult mouse ventricular myocytes

H Xu et al. J Gen Physiol. 1999 May.

Abstract

In the experiments here, the time- and voltage-dependent properties of the Ca2+-independent, depolarization-activated K+ currents in adult mouse ventricular myocytes were characterized in detail. In the majority (65 of 72, approximately 90%) of cells dispersed from the ventricles, analysis of the decay phases of the outward currents revealed three distinct K+ current components: a rapidly inactivating, transient outward K+ current, Ito,f (mean +/- SEM taudecay = 85 +/- 2 ms); a slowly (mean +/- SEM taudecay = 1,162 +/- 29 ms) inactivating K+ current, IK,slow; and a non inactivating, steady state current, Iss. In a small subset (7 of 72, approximately 10%) of cells, Ito,f was absent and a slowly inactivating (mean +/- SEM taudecay = 196 +/- 7 ms) transient outward current, referred to as Ito,s, was identified; the densities and properties of IK,slow and Iss in Ito,s-expressing cells are indistinguishable from the corresponding currents in cells with Ito,f. Microdissection techniques were used to remove tissue pieces from the left ventricular apex and from the ventricular septum to allow the hypothesis that there are regional differences in Ito,f and Ito,s expression to be tested directly. Electrophysiological recordings revealed that all cells isolated from the apex express Ito,f (n = 35); Ito,s is not detected in these cells (n = 35). In the septum, by contrast, all of the cells express Ito,s (n = 28) and in the majority (22 of 28, 80%) of cells, Ito,f is also present. The density of Ito,f (mean +/- SEM at +40 mV = 6.8 +/- 0.5 pA/pF, n = 22) in septum cells, however, is significantly (P < 0.001) lower than Ito,f density in cells from the apex (mean +/- SEM at +40 mV = 34.6 +/- 2.6 pA/pF, n = 35). In addition to differences in inactivation kinetics, Ito,f, Ito,s, and IK,slow display distinct rates of recovery (from inactivation), as well as differential sensitivities to 4-aminopyridine (4-AP), tetraethylammonium (TEA), and Heteropoda toxin-3. IK,slow, for example, is blocked selectively by low (10-50 microM) concentrations of 4-AP and by (>/=25 mM) TEA. Although both Ito,f and Ito,s are blocked by high (>100 microM) 4-AP concentrations and are relatively insensitive to TEA, Ito,f is selectively blocked by nanomolar concentrations of Heteropoda toxin-3, and Ito,s (as well as IK,slow and Iss) is unaffected. Iss is partially blocked by high concentrations of 4-AP or TEA. The functional implications of the distinct properties and expression patterns of Ito,f and Ito,s, as well as the likely molecular correlates of these (and the IK,slow and Iss) currents, are discussed.


Figures

Figure 1
Figure 1
Differences in the waveforms of the Ca2+-independent, depolarization-activated K+ currents in myocytes randomly dispersed from adult mouse (left and right) ventricles. Whole-cell outward K+ currents were evoked during 500-ms (A and C) and 4.5-s (B and D) depolarizing voltage steps to potentials between −40 and +60 mV from a holding potential of −70 mV; each trial was preceded by a brief (20 ms) depolarization to −20 mV to eliminate contamination from voltage-gated inward Na+ currents not blocked completely by tetrodotoxin (note the inward currents at early times in the records in A and C). The records in A and B were obtained from the same cell, and those in C and D were from the same cell; only the durations of the voltage steps in A and B (and C and D) are different. As is evident, peak outward current amplitudes in A and B are substantially larger than those in C and D. In addition, the decay phases of the outward K+ currents in C and D are slower than those in A and B; the rapidly inactivating transient outward K+ current, Ito,f, is not evident in the records in C and D (see text). Scale bars: A and B, 4 nA and 55 ms; B and D, 4 nA and 500 ms.
Figure 2
Figure 2
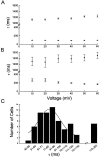
Multiple components of inactivation in adult mouse ventricular myocytes. The decay phases of the outward currents, recorded as described in Fig. 1 during 4.5-s depolarizing voltage steps to test potentials between +10 and +60 mV, were fitted using the equation: y(t) = A 1 * exp(−t1) + A 2 * exp(−t2) + A ss (see materials and methods); time zero was set at the peak of the outward current. Mean ± SEM inactivation time constants for the fast and slow components of inactivation in cells with (A, n = 65) and without (B, n = 7) the rapidly decaying outward K+ current, Ito,f, are plotted. As is evident, none of the inactivation time constants displays any appreciable voltage dependence (see text). The mean ± SEM inactivation time constants for the slowly decaying currents (IK,slow) are indistinguishable in the two groups of cells, whereas the fast inactivation time constants are significantly (P < 0.001) different (see text). (C) Fast inactivation time constants in the majority of mouse ventricular myocytes (65 of 72) are normally distributed. Inactivation time constants were determined in individual cells from the double exponential fits to the decay phases of the currents and binned (10 ms). The solid line is a simple Gaussian fit to the data points in the majority of the cells (65 of 72); the seven cells lacking Ito,f (and with a mean ± SEM τdecay = 196 ± 7 ms) clearly fall outside this normal distribution (see text).
Figure 3
Figure 3
Regional differences in Ca2+-independent, depolarization-activated K+ currents in isolated adult mouse left ventricular myocytes. Outward K+ currents were recorded as described in Fig. 1 during 4.5-s depolarizing voltage steps to potentials between −40 and +60 mV from a holding potential of −70 mV; the records displayed are from three different cells: one isolated from the apex (A) and the other two from the septum (B and C). As is evident, peak outward current amplitudes in A are substantially larger than those in B and C. In addition, the decay phases of the outward K+ currents in C are slower than those in A or B and the rapidly inactivating transient K+ current, Ito,f that is so prominent in A is not evident in the records in C (see text). Scale bars, 2 nA and 500 ms.
Figure 4
Figure 4
Effects of varying concentrations of 4-AP on adult mouse ventricular K+ currents. Outward K+ currents were recorded as described in Fig. 1 during 4.5-s depolarizing voltage steps to −20 to +60 mV from a holding potential of −70 mV; records from three cells exposed to different concentrations (10 μM, 0.5 mM, and 5 mM) of 4-AP are presented. In each example, control currents (A, D, and G) were recorded before application of 4-AP; cells were the exposed to (10 μM, 0.5 mM, or 5 mM) 4-AP, and when the effect (of 4-AP) reached steady state, the currents in the presence of 10 μM (B), 0.5 mM (E), and 5 mM (H) 4-AP were recorded. In B, E, and H, the currents in the presence of 4-AP are plotted as solid lines, and the control records (A, D, and G, respectively) are replotted as points to facilitate comparison. The waveforms of the 10 μM (C), 0.5 mM (F), and 5 mM (I) 4-AP–sensitive currents were obtained by off-line digital subtraction of the currents in the presence of 4-AP from the controls. For each 4-AP concentration, similar results were obtained in experiments on four cells. Scale bars, 2 nA and 500 ms.
Figure 5
Figure 5
Ito,s is blocked by high (0.5 mM), but not by low (10 μM), concentrations of 4-AP. Outward K+ currents were recorded from a cell isolated from the septum as described in Fig. 1 during 4.5-s depolarizing voltage steps from −30 to +60 mV from a holding potential of −70 mV; all of the records displayed are from the same cell. Control currents (A) and currents in the presence of 10 μM (B) or 0.5 mM (D) 4-AP were recorded. In B and D, the currents recorded in the presence of 10 μM (B) and 0.5 mM (D) 4-AP are plotted as solid lines, and the control records (in the absence of 4-AP, A) are replotted as points to facilitate comparison. The waveforms of the 10 μM (C) and 0.5 mM (E) 4-AP–sensitive currents were obtained by off-line digital subtraction of the current records in the presence of 10 μM (B) or 0.5 mM (D) 4-AP from the controls (A). Similar results were obtained in experiments on four septum cells. Scale bars, 1 nA and 500 ms.
Figure 6
Figure 6
TEA blocks IK,slow and Iss in adult mouse ventricular myocytes. Outward currents were recorded as described in Fig. 1 during 4.5-s depolarizing voltage steps to −20 to +60 mV from a holding potential of −70 mV; records from two cells exposed to 25 (A–C) or 135 (D–F) mM are presented. In each example, control currents (A and D) were recorded before application of TEA; cells were the exposed to 25 or 135 mM TEA, and when the effect (of TEA) reached steady state, the currents in the presence of 25 (B) or 135 (E) mM TEA were recorded. In B and E, the currents in the presence of 4-AP are plotted as solid lines, and the control records (A and D, respectively) are replotted as points to facilitate comparison. The waveforms of the 25-mM (C) and 135-mM (F) TEA-sensitive currents were obtained by off-line digital subtraction of the currents in the presence of TEA from the controls. Similar results were obtained in experiments on three (25 mM TEA) or four (135 mM TEA) cells. Scale bars, 2 nA and 500 ms.
Figure 7
Figure 7
Ito,f is selectively blocked by HpTx-3. Outward currents were recorded in mouse ventricular myocytes isolated from the apex and septum as described in Fig. 1 during 4.5-s depolarizing voltage steps to potentials between −20 and +60 mV from a holding potential of −70 mV; A–C in each panel were obtained from the same cell. In each cell, control currents (A) were recorded before exposure to 100 or 300 nM HpTx-3; outward K+ currents were again recorded after the effect of HpTx-3 reached a steady state (B). (B) The currents in the presence of HpTx-3 are plotted as solid lines, and the control records (A) are replotted as points to facilitate comparison. Off-line digital subtraction of the currents in the presence of HpTx-3 (B) from the controls (A) revealed that only the rapidly inactivating K+ current, Ito,f, in apex and septum cells is affected by HpTx-3 (C). Similar results were obtained in experiments on four cells. Scale bars, 2 nA and 500 ms.
Figure 8
Figure 8
Ito,f, Ito,s, IK,slow, and Iss display similar voltage dependences (A), but different rates (B) of activation. (A) Outward currents were recorded as described in Fig. 1 during 4.5-s depolarizing voltage steps to potentials between −40 and +60 mV from a holding potential of −70 mV. The amplitudes of Ito,f, Ito,s, IK,slow, and Iss at each test potential in each cell were determined from exponential fits to the decay phases of the total outward currents (see text), normalized to the current amplitude at +60 mV (in the same cell), and mean ± SEM normalized Ito,f (•), Ito,s (▴), IK,slow (▪), and Iss (♦) are plotted (A) as a function of test potential. (B) Activation time constants were determined from single exponential fits to the rising phases of the separated outward K+ currents (see text) evoked during depolarizing voltage steps from 0 to +60 mV. (B) Mean ± SEM activation time constants for Ito,f (•), IK,slow (▪), and Iss (♦) are plotted (as points) as a function of test potential. The solid lines represent the best single exponential fits to the data points (see text).
Figure 9
Figure 9
Voltage dependences of steady state inactivation of Ito,f, Ito,s, and IK,slow. To examine the voltage dependences of steady state inactivation, outward K+ currents evoked during 5-s depolarizations to +50 mV after 5-s conditioning prepulses to potentials between −100 and −10 mV were recorded in mouse myocytes isolated from the apex (A) and septum (B) of the left ventricle; the protocol is illustrated below the current records. The amplitudes of Ito,f, Ito,s, and IK,slow evoked at +50 mV from each conditioning potential were determined from double (or triple) exponential fits to the decay phases of the total outward currents (see text), and these values were normalized to the current amplitudes evoked from −100 mV (in the same cell). Mean ± SEM (n = 7) normalized Ito,f (•), Ito,s (▴), and IK,slow (•) amplitudes were then determined and are plotted as a function of conditioning potential in C. The solid lines reflect the best single (Ito,f) or double (Ito,s and IK,slow) Boltzmann fits to the mean normalized data (see text). The scale bars, (A and B) 2 nA and 1 s.
Figure 10
Figure 10
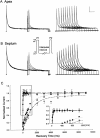
The rates of recovery of Ito,f, Ito,s, and IK,slow from steady state inactivation are distinct. After inactivating the currents during 9.5-s prepulses to +50 mV, cells were hyperpolarized to −70 mV for times ranging from 0 ms to 10 s before a second (test) depolarization to +50 mV (to assess the extent of recovery); the experimental protocol is illustrated between the records. Typical current waveforms recorded in cells isolated from the apex (A) and septum (B) during the +50-mV conditioning step and the +50-mV test depolarization after varying recovery times are displayed. Currents recorded after brief (10–190 ms) recovery periods are displayed on the left and typical currents seen after longer recovery times (250–1,090 ms) are on the right in A and B. The amplitudes of Ito,f, Ito,s, and IK,slow evoked at +50 mV after each recovery period were determined from double (or triple) exponential fits to the decay phases of the total outward currents (see text), and normalized to the current amplitudes evoked after the 10-s recovery period (in the same cell). Mean ± SEM normalized recovery data for Ito,f (•, ○), Ito,s (▴), and IK,slow (▪) are plotted in C; the initial phase of recovery of the currents is shown on an expanded time scale (inset). The two sets of Ito,f data were obtained from cells isolated from the apex (•) and septum (○) and, as is evident, recovery of Ito,f in the two cells types is indistinguishable. The mean ± SEM (n = 9) normalized recovery data for Ito,f (•, ○), Ito,s (▴), and IK,slow (▪) are well described by a single exponential (see text). Scale bars, (A and B) 500 pA and 2.5 s.

Similar articles

Cited by

References

    1. Antzelevitch, C., S. Sicouri, A. Lukas, V.V. Nesterenko, D.-W. Liu, and J.M. DiDiego. 1995. Regional differences in the electrophysiology of ventricular cells: physiological implications. In Cardiac Electrophysiology: From Cell to Bedside. D.P. Zipes and J. Jalife, editors. W. B. Saunders Co., Philadelphia. 228–245.
    1. Anumonwo JMB, Freeman LC, Kwok WM, Kass RS. Potassium channels in the heart: electrophysiology and pharmacological regulation. Cardiovasc Drug Rev. 1991;9:299–316.
    1. Barry DM, Nerbonne JM. Myocardial potassium channels: electrophysiological and molecular diversity. Annu Rev Physiol. 1996;58:363–394. - PubMed
    1. Barry DM, Trimmer JS, Merlie JP, Nerbonne JM. Differential expression of voltage-gated K+ channel subunits in adult rat heart: relationship to functional K+channels. Circ Res. 1995;77:361–369. - PubMed
    1. Barry DM, Xu H, Schuessler RB, Nerbonne JM. Functional knockout of the cardiac transient outward current, long QT syndrome and cardiac remodelling in mice expressing a dominant negative Kv4 α subunit. Circ Res. 1998;83:560–567. - PubMed

Publication types

Substances