. 1999 May;10(5):1665-83.
doi: 10.1091/mbc.10.5.1665.

Ras family GTPases control growth of astrocyte processes

Affiliations
Free PMC article

Ras family GTPases control growth of astrocyte processes

D Kalman et al. Mol Biol Cell. 1999 May.
Free PMC article

Abstract

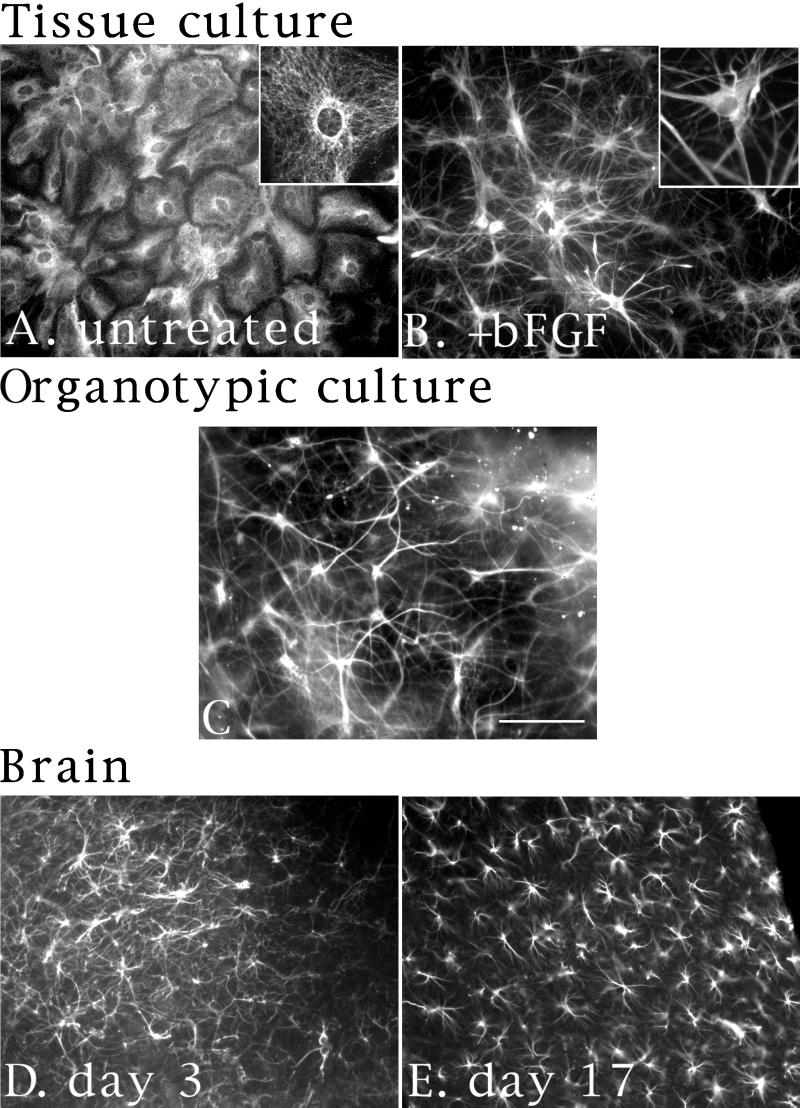
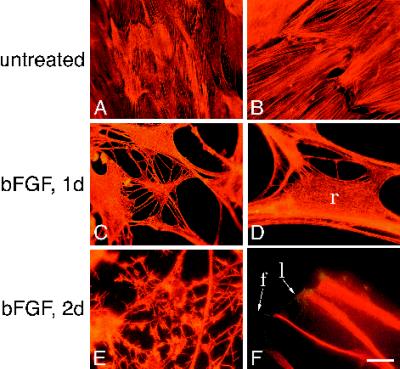
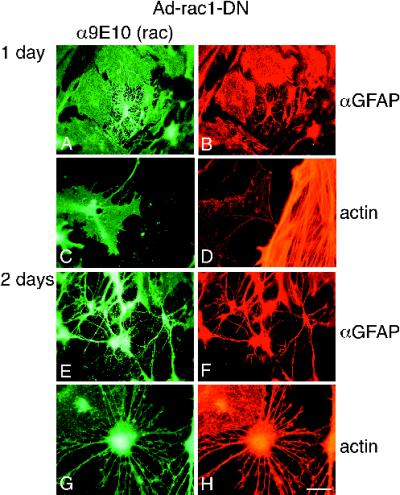
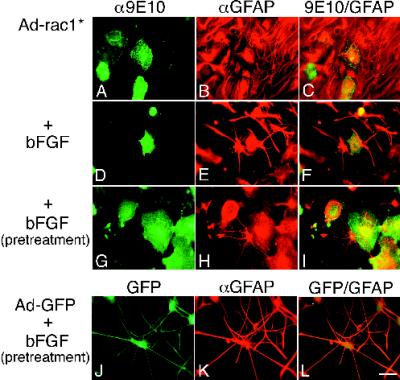
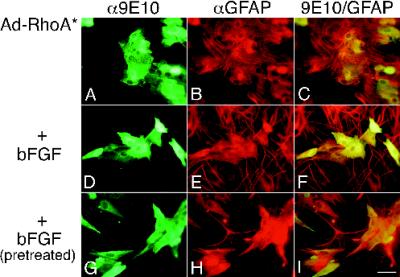
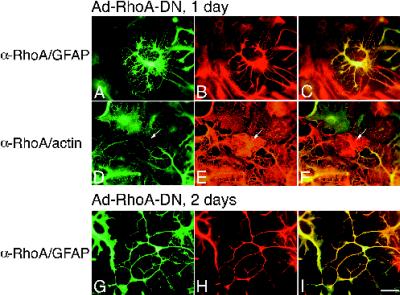
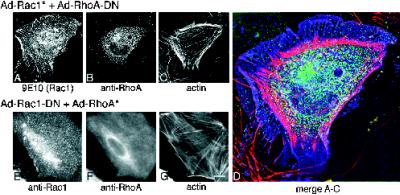
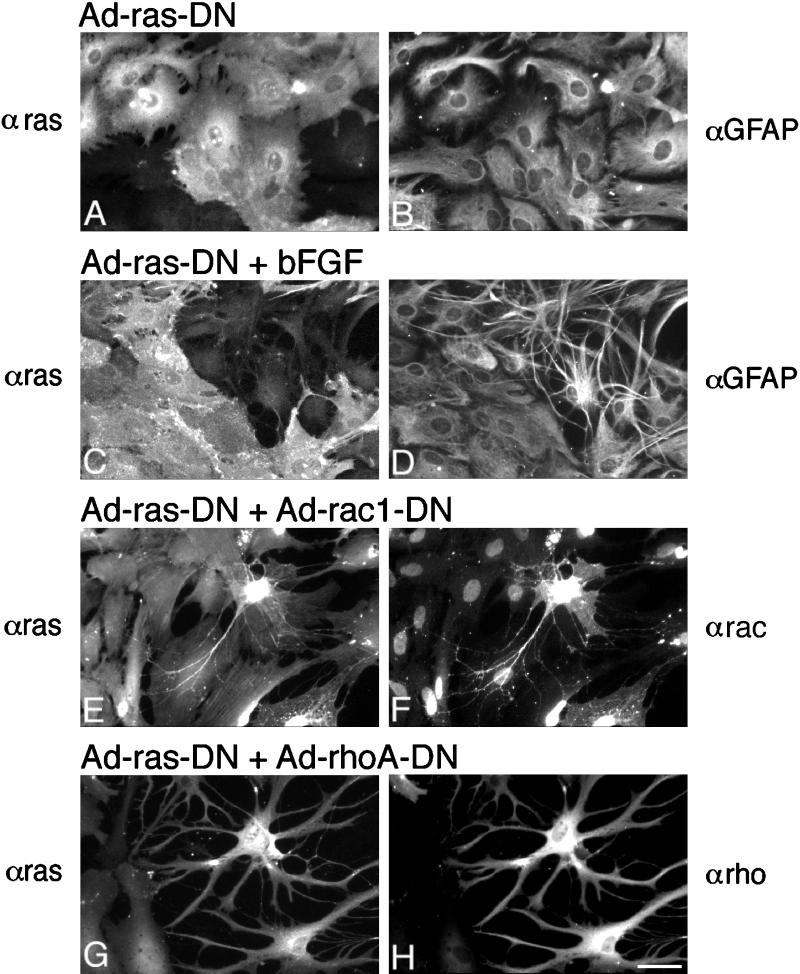
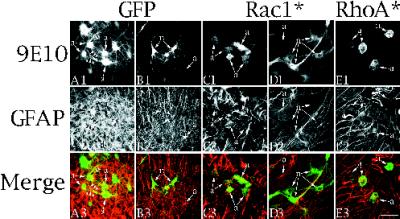
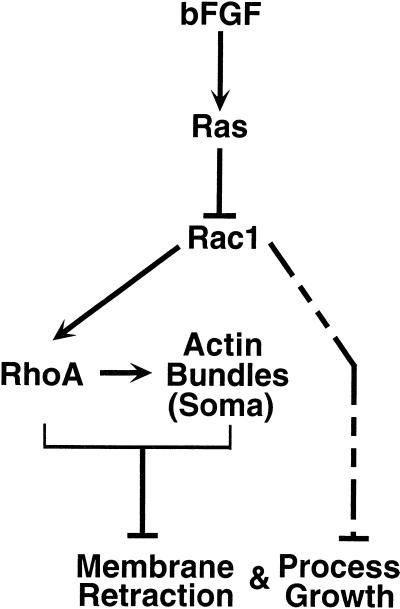
Astrocytes in neuron-free cultures typically lack processes, although they are highly process-bearing in vivo. We show that basic fibroblast growth factor (bFGF) induces cultured astrocytes to grow processes and that Ras family GTPases mediate these morphological changes. Activated alleles of rac1 and rhoA blocked and reversed bFGF effects when introduced into astrocytes in dissociated culture and in brain slices using recombinant adenoviruses. By contrast, dominant negative (DN) alleles of both GTPases mimicked bFGF effects. A DN allele of Ha-ras blocked bFGF effects but not those of Rac1-DN or RhoA-DN. Our results show that bFGF acting through c-Ha-Ras inhibits endogenous Rac1 and RhoA GTPases thereby triggering astrocyte process growth, and they provide evidence for the regulation of this cascade in vivo by a yet undetermined neuron-derived factor.


Figures

Figure 1
Figure 1
bFGF induces processes in hippocampal CA1/CA3 astrocytes. (A and B) Images of astrocytes cultured for 1 wk and left untreated (A) or treated with bFGF (20 nM) for 2 d (B). Cells were stained with a polyclonal α-GFAP antibody and a FITC-conjugated secondary antibody. Insets are higher-magnification images of identically stained cells. (C) Images of hippocampal astrocytes grown in organotypic slice cultures. After 3 d, cells were fixed and stained with a polyclonal α-GFAP antibody and a Cy-5–conjugated secondary antibody. (D and E) Images of astrocytes from brains of P3 (D) or P17 (E) animals. Brains were fixed and sectioned, and then stained as in C above. Bar (in C): A, B, D, and E, 20 μm; C and insets in A and B, 10 μm.
Figure 2
Figure 2
bFGF induces actin bundles to disassemble in retracting areas but not in processes. (A–F) Images of astrocytes left untreated (A and B) or treated with bFGF for 1 d (C and D) or 2 d (E and F) and stained with rhodamine–phalloidin (A–E) or with rhodamine–phalloidin, α-GFAP, and a Texas Red (TR)-conjugated secondary antibody (F). f and l in F refer to filopodia and lamellipodia, respectively. r in D denotes retracting area. Bar (in F): A, C, and E, 32 μm; B, D, 12.5 μm; F, 10.5 μm.
Figure 3
Figure 3
Rac1-DN causes morphological differentiation and actin bundle reorganization. Images of astrocytes infected with Ad-Rac1-DN and Ad-tetR-VP16 at high m.o.i. for 1 d (A–D) or 2 d (E–H), and stained with 9E10 and a secondary fluorescein-conjugated antibody to detect Rac1-DN (A, C and E), together with either α-GFAP and a TR-conjugated secondary antibody to identify the cells as astrocytes (B and F), or rhodamine–phalloidin (D and H). Bar (in H): A–C, E, and F, 27 μm; D, G, and H, 11 μm. Note that C and D are low- and high-magnification images, respectively, of the same cells. The cell on the left in C and D expresses Rac1-DN.
Figure 4
Figure 4
Rac1* blocks and reverses bFGF-induced morphological changes. (A–F) Images of cells infected with Ad-Rac1* and left untreated (A–C) or treated with bFGF (D–F) for 2 d. Cells were stained with 9E10 and a fluorescein-conjugated secondary antibody to identify recombinant protein (A and D), together with α-GFAP and a TR-conjugated secondary antibody to identify the cells as astrocytes (B and E). Double exposures are shown in C and F. Note that uninfected cells in E have processes. The cells in A–C are from 3-wk-old cultures that exhibited some spontaneous morphological changes. (G–L) Images of cells that were pretreated with bFGF for 1 wk and then infected for 2 d with Ad-Rac1* (G–I) or Ad-GFP (J–L) and maintained in bFGF. G–I were stained as in A–F. J–L were stained only with the α-GFAP/TR secondary antibody. GFP is visible in the fluorescein channel (J). Double exposures are shown in I and L. Bar, 25 μm.
Figure 5
Figure 5
RhoA* blocks and reverses bFGF-induced morphological changes. (A–F) Images of cells infected with Ad-RhoA* and left untreated (A–C) or treated with bFGF for 3 d (D–F). Infected cells were recognized by 9E10/FL staining (A and D), and the cells were identified as astrocytes by GFAP/TR staining (B and E). C and F are double exposures. (G–I) Images of cells pretreated with bFGF for 1 wk and then infected for 2 d with Ad-RhoA* and maintained in bFGF. G–I were stained as in A–F. I is a double exposure. Bar, 25 μm.
Figure 6
Figure 6
RhoA-DN induces morphological differentiation of astrocytes. (A–F) Images of cells infected with Ad-RhoA-DN at high m.o.i. for 1 d. (A–C) Images of cells stained with α-RhoA antibody/FL conjugate to recognize infected cells (A) together with α-GFAP/TR conjugate to identify the cells as astrocytes (B). (D–F) Images of cells stained with α-RhoA antibody/FL conjugate (D) together with rhodamine–phalloidin to recognize actin (E). C and F are double exposures. Note that the uninfected cell in the center of the image in D–F (arrow) has actin fibers (E). (G–I) Images of cells infected for 2 d with Ad-RhoA-DN and stained with α-RhoA/FL (G) together with α-GFAP/TR (H). Bar, 25 μm.
Figure 7
Figure 7
Effects of GTPase combinations on astrocyte morphology. (A–D) Images of cells infected with Rac1* plus RhoA-DN. Images are composed of light from a 0.4-μm-thick parfocal z-section. Out of focus light from above and below this section were eliminated using wide-field deconvolution algorithms (see MATERIALS AND METHODS). Infected cells were recognized by staining with 9E10/fluorescein conjugate to recognize Rac1* (A) together with α-RhoA/Cy-5 conjugate (B) and rhodamine–phalloidin (C). These three images are merged in D. Rac1 is pseudocolored blue, RhoA is pseudocolored green, and actin is pseudocolored pink. The RhoA-DN was not epitope-tagged, so the 9E10 antibody could be used to detect Rac1*. Note that the actin is concentrated in the cell periphery, RhoA-DN is restricted to the cell interior, and Rac1* is uniformly distributed throughout the cell. (E–G) Images of cells infected with Rac1-DN plus RhoA*. Cells were stained with α-Rac/FL conjugate to recognize the Rac1-DN protein together with α-RhoA/Cy5 conjugate to recognize the RhoA* protein. The presence of a myc epitope tag on both protein types obviated the use of the 9E10 antibody. Note that the actin bundle staining in G resembles untreated cells. E–G were photographed using a standard microscope. Bar (in G): A–C, G–I, 8 μm; D, 3.3 μm.
Figure 8
Figure 8
Ha-Ras-DN blocks bFGF-induced morphological changes but not Rac1-DN- or RhoA-DN-induced effects. (A–D) Images of cells infected with Ha-Ras-DN and left untreated (A and B) or treated with bFGF for 3 d (C and D). Infected cells were recognized by staining with an α-Ha-Ras mAb/FL conjugate (A and C), and the cells were identified as astrocytes by staining with α-GFAP/Cy-5 conjugate. (E and F) Ha-Ras-DN does not block the effects of Rac1-DN. Images of cells infected with Ad-Ha-Ras-DN plus Ad-Rac1-DN, grown for 2 d and stained with α-Ha-Ras/FL (E) together with α-Rac1/Cy5 (F). Note that although all cells are expressing the Ha-Ras-DN protein, only the process-bearing cell additionally expresses Rac1-DN. The α-Rac1 antibody used also recognizes antigenic sites in the nuclei of cells not infected with Ad-Rac1-DN. (G and H) Ha-Ras-DN does not block RhoA-DN-induced changes. Cells were infected with Ad-Ha-Ras-DN plus Ad-RhoA-DN, grown for 2 d, and stained with α-Ha-Ras/FL (G) together with α-RhoA/Cy5, which recognizes the RhoA-DN protein (H). Note that the process-bearing cells on the right express both Ha-Ras-DN and RhoA-DN. Bar, 27 μm.
Figure 9
Figure 9
Effects of Rac1* and RhoA* on process growth in neurons and astrocytes in cultured organotypic hippocampal slices. (A1–A3 and B1–B3) Confocal images of cells from organotypic slices infected for 2 d with Ad-GFP and stained with 9E10/FITC (A1 and B1) together with GFAP/Cy5 (A2 and B2) to identify the cells as astrocytes. Cells labeled “a” (astrocytes) are identifiable in the GFAP/Cy5 channel, whereas cells labeled “n” (neurons) were not. Other experiments confirmed that GFAP-negative cells stained with neuronal markers such as MAP2. Images in A1 and B1 result from GFP fluorescence and not 9E10 staining because uninfected cultures had no signal in any plane in the FITC channel. Images from the top row (A1–E1) were pseudocolored green, and images from the middle row (A2–E2) were pseudocolored red. The pseudocolored images were combined to generate the merged image in the third row (A3–E3). (C1–C3 and D1–D3) Confocal images of cells from organotypic cultures infected for 2 d with Ad-Rac1* and stained as above. Rac1* causes loss of processes on astrocytes (a in C) but not on neurons (n in D). The neurons are not evident in the GFAP/Cy5 channel (D2). (E1–E3) Confocal images of cells from organotypic cultures infected with Ad-RhoA* and stained as above. Note that RhoA* causes loss of processes on astrocytes (a). Insets illustrate the effects of RhoA* on neurons. n in the inset identifies a cell lacking processes that is not evident in the GFAP channel (E2 inset).
Figure 10
Figure 10
Model of bFGF signal transduction cascade in primary hippocampal CA1/CA3 astrocytes. In this model, Rac1 and RhoA are constitutively active in resting cells. Rac1 causes lamellipodia to form on the cell periphery, and RhoA maintains actin bundles. As in fibroblasts, Rac1 appears to act as an upstream activator of RhoA. Addition of bFGF activates Ha-Ras which in turn inhibits Rac1. Loss of Rac1 activity thereby results in loss of RhoA activity. This cascade leads to reorganization of actin bundles in the soma and membrane retraction. The cascade also causes initiation of process growth at discrete sites on the periphery. Although membrane retraction per se is independent of process growth, either RhoA or actin bundles or both inhibit process growth. Rac1 can directly affect process growth and membrane retraction (dashed line) in a manner that depends on the degree or site of inhibition or both.

Similar articles

Cited by

References

    1. Arman E, Haffner-Krausz R, Chen Y, Heath JK, Lonai P. Targeted disruption of fibroblast growth factor (FGF) receptor 2 suggests a role for FGF signaling in pregastrulation mammalian development. Proc Natl Acad Sci USA. 1998;95:5082–5087. - PMC - PubMed
    1. Baorto DM, Mellado W, Shelanski ML. Astrocyte process growth induction by actin breakdown. J Cell Biol. 1992;117:357–367. - PMC - PubMed
    1. Bignami A, Eng LF, Dahl D, Uyeda CT. Localization of the glial fibrillary acidic protein in astrocytes by immunofluorescence. Brain Res. 1972;43:429–435. - PubMed
    1. Cameron RS, Rakic P. Glial cell lineage in the cerebral cortex: a review and synthesis. Glia. 1991;4:124–137. - PubMed
    1. Chen SY, Huff SY, Lai CC, Der CJ, Powers S. Ras-15A protein shares highly similar dominant-negative biological properties with Ras-17N and forms a stable, guanine-nucleotide resistant complex with CDC25 exchange factor. Oncogene. 1994;9:2691–2698. - PubMed

Publication types

MeSH terms