Role of interleukin-2 in superantigen-induced T-cell anergy
- PMID: 10233695
- PMCID: PMC2326740
- DOI: 10.1046/j.1365-2567.1999.00627.x
Role of interleukin-2 in superantigen-induced T-cell anergy
Abstract
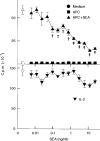
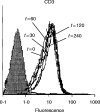
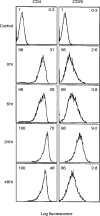
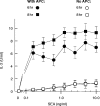
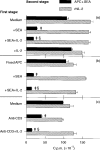
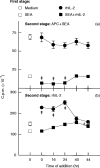
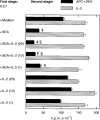
T-cell anergy is a state of immunological tolerance characterized by unresponsiveness to antigenic stimulation. Previous studies have shown that anergy is induced in T cells following stimulation in the absence of adequate costimulatory signals. These cells fail to respond to stimulation via the T-cell receptor (TCR), and fail to produce normal levels of interleukin-2 (IL-2). We present results here which show that low concentrations of the superantigen staphylococcal enterotoxin A (SEA) in the absence of antigen-presenting cells induced both proliferation and anergy in the A.E7 T-cell clone. Furthermore, under these conditions, the A.E7 clone remained responsive to exogenous IL-2. Fluorescence-activated cellular cytometry analysis revealed unaltered expression of the TCR/CD3 complex in the anergized clone; however, both CD4 and CD25 expression increased after 24 hr of stimulation by SEA under these conditions. Interestingly, a low level of IL-2 production was measured during the induction of anergy. Most strikingly, stimulation of the A.E7 clone by SEA in combination with exogenous IL-2 resulted in a more pronounced state of anergy. These results suggest that the induction of anergy is a process that is essentially independent of the production of IL-2.
Figures

Similar articles
-
Uncoupling of T cell receptor zeta chain function during the induction of anergy by the superantigen, staphylococcal enterotoxin A.Toxins (Basel). 2010 Jul;2(7):1704-17. doi: 10.3390/toxins2071704. Epub 2010 Jun 30. Toxins (Basel). 2010. PMID: 22069657 Free PMC article.
-
Differential effects of superantigen-induced "anergy" on priming and effector stages of a T cell-dependent antibody response.Eur J Immunol. 1994 Feb;24(2):445-9. doi: 10.1002/eji.1830240227. Eur J Immunol. 1994. PMID: 8299694
-
In vivo anergized CD4+ T cells express perturbed AP-1 and NF-kappa B transcription factors.Proc Natl Acad Sci U S A. 1996 Feb 6;93(3):979-84. doi: 10.1073/pnas.93.3.979. Proc Natl Acad Sci U S A. 1996. PMID: 8577772 Free PMC article.
-
The role of anergy in peripheral T cell unresponsiveness.Life Sci. 1994;55(23):1767-80. doi: 10.1016/0024-3205(94)90087-6. Life Sci. 1994. PMID: 7968257 Review.
-
Superantigens: a tool to gain new insight into cellular immunity.Res Immunol. 1997 Jul-Aug;148(6):373-86. doi: 10.1016/s0923-2494(97)82871-4. Res Immunol. 1997. PMID: 9443577 Review. No abstract available.
Cited by
-
Uncoupling of T cell receptor zeta chain function during the induction of anergy by the superantigen, staphylococcal enterotoxin A.Toxins (Basel). 2010 Jul;2(7):1704-17. doi: 10.3390/toxins2071704. Epub 2010 Jun 30. Toxins (Basel). 2010. PMID: 22069657 Free PMC article.
References
-
- Damle NK, Klussman K, Linsley PS, Aruffo A. Differential costimulatory effects of adhesion molecules B7, ICAM-1, LFA-3, and VCAM-1 on resting and antigen-primed CD4+ T lymphocytes. J Immunol. 1992;148:1985. - PubMed
-
- Damle NK, Linsley PS, Ledbetter JA. Direct helper T cell-induced B cell differentiation involves interaction between T cell antigen CD28 and B cell activation antigen B7. Eur J Immunol. 1991;21:1277. - PubMed
-
- Fischer H, Gjorloff A, Hedlund G, et al. Stimulation of human naive and memory T helper cells with bacterial superantigen. Naive CD4+45RA+ T cells require a costimulatory signal mediated through the LFA-1/ICAM-1 pathway. J Immunol. 1992;148:1993. - PubMed
-
- Gjorloff A, Hedlund G, Kalland T, et al. The LFA-3 adhesion pathway is differently utilized by superantigen-activated human CD4+ T-cell subsets. Scand J Immunol. 1992;36:243. - PubMed
Publication types
MeSH terms
Substances
Grants and funding
LinkOut - more resources
Full Text Sources
Research Materials

