. 1999 Apr;154(4):1089-96.
doi: 10.1016/s0002-9440(10)65361-8.

Murine acid alpha-glucosidase: cell-specific mRNA differential expression during development and maturation

Affiliations

Murine acid alpha-glucosidase: cell-specific mRNA differential expression during development and maturation

E Ponce et al. Am J Pathol. 1999 Apr.

Abstract

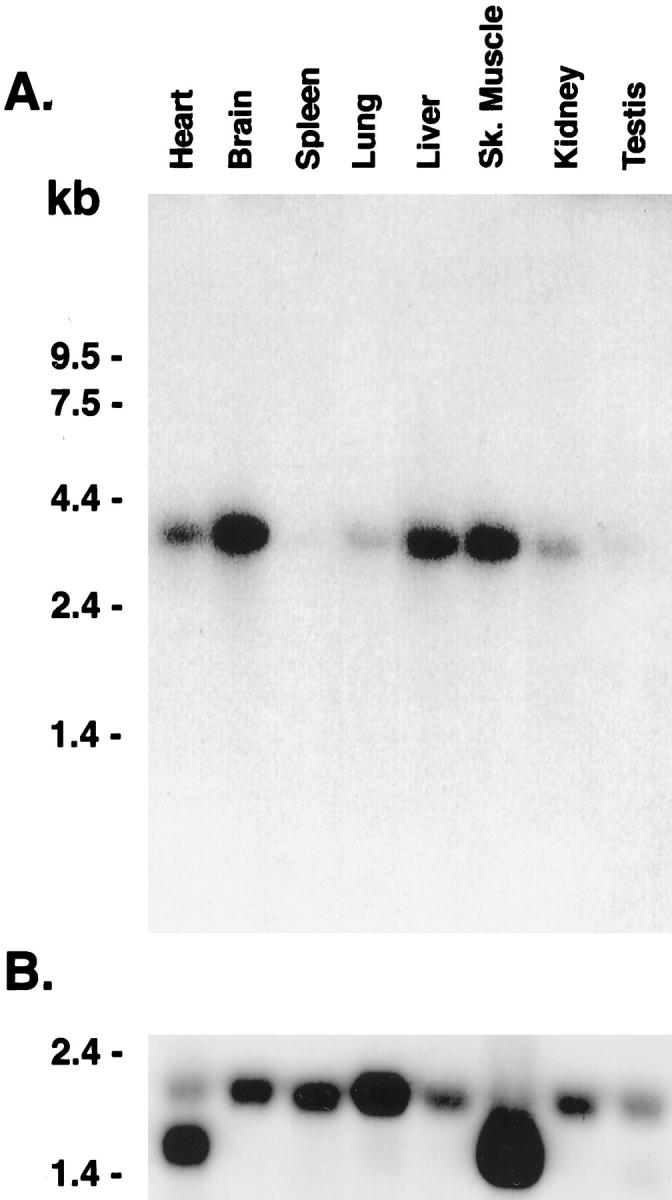
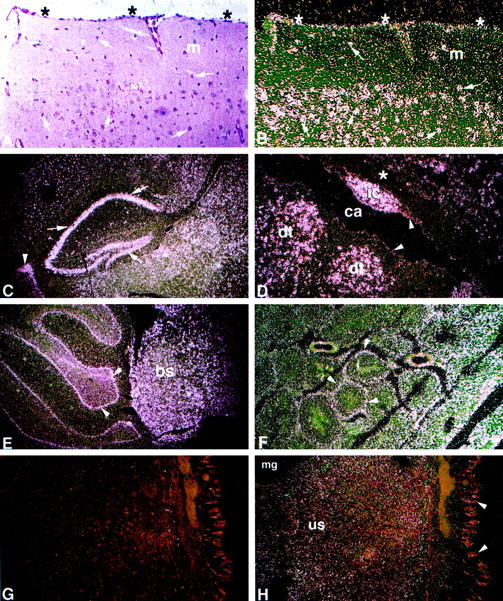
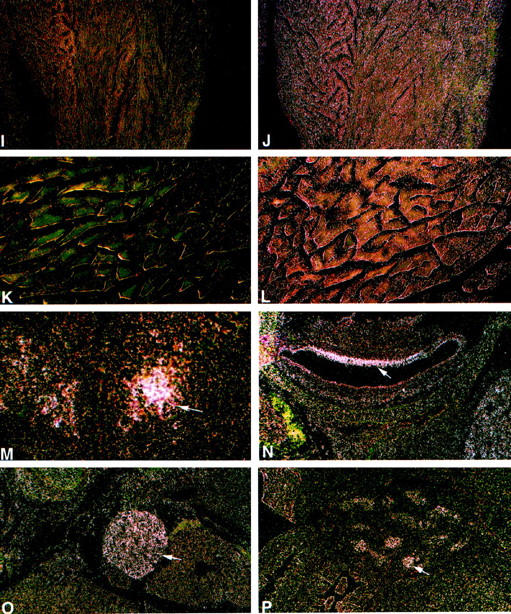
Acid alpha-glucosidase (GAA) cleaves the alpha1-4 and alpha1-6 glycosidic linkages of glycogen and related alpha-glucosyl substrates within lysosomes. Its deficiency results in glycogen storage disease type II (GSDII) variants including Pompe disease. To gain insight into the tissue patterns of involvement by glycogen storage in GSDII, GAA mRNA expression in mouse tissues was evaluated by Northern blot and in situ hybridization analyses. Extensive temporal and spatial variation of GAA mRNA was observed. During preterm maturation, GAA mRNA levels of whole mice progressively increased as assessed by Northern analysis. By in situ hybridization with GAA antisense mRNA, low signals were detected in most tissues throughout gestation. However, increased expression in specific cell types of different tissues was observed beginning at 16 days post coitum in developing brain neurons, primitive inner ear cells, and seminiferous tubular epithelium. In adult mice, whole-organ GAA mRNA levels were highest in brain, moderate in heart, liver, and skeletal muscle, and lowest in the series kidney > lung > testis > spleen. By in situ hybridization, the highest-intensity signals were in neurons of the central and peripheral nervous systems whereas neuroglial cells had only low-level signal. Signals of moderate intensity were in cardiomyocytes whereas low signals were in hepatocytes and skeletal muscle myocytes and very low in cells of the lungs, thymus, pancreas, spleen, and adrenal glands. However, testicular Sertoli cells and kidney tubular epithelial cells had significant signals even though surrounding cells had very low signals. The discrete temporal and spatial variations of GAA mRNA during development indicate different physiological roles for this enzyme in various cell types and developmental stages.


Figures

Figure 1.
Figure 1.
Northern blot analysis of acid α-glucosidase mRNA. A: Membranes containing BALB/c mice poly A+ RNA (2 μg) were hybridized with a 32P-labeled mouse GAA cDNA fragment (see Materials and Methods). A 3.8-kb species of variable levels was present in heart, brain, spleen, lung, liver, skeletal muscle, kidney, and testis. B: The β-actin 2.0- and/or 1.8-kb specific signal(s) are present in all lanes. This demonstrates mRNA integrity and is a reference for quantitative comparisons. RNA size markers are indicated on the left margin. Exposure time in A and B was 24 hours.
Figure 2.
Figure 2.
Spatial and temporal expression of the mouse GAA mRNA by in situ hybridization. A: Bright-field image with H&E. B to K: Dark-field images for the sense (G, I, and K) and for the antisense (B–F, H, J, and L–P) 35S-labeled riboprobes. A to L: Adult tissues. High-intensity signal is present in neurons throughout the neuraxis (B–E). A and B: Cerebral cortex. Pyramidal and granule neurons (arrows) have large purple nuclei by H&E (A) and show high-intensity signal (B). Signal of lower intensity is in the molecular layer (m). Moderate-intensity signal is in meningeal cells of the pia mater-arachnoid (*). C: Cerebral sagittal section. Highest-intensity signals are in neurons of the hippocampus (arrows), cells lining the choroid plexus (arrowhead), and surrounding neuronal layers. D: Cerebrum/aqueduct of Sylvius. High-intensity signal is in neurons adjacent to the cerebral aqueduct (ca) located in the inferior colliculus nucleus (ic) and dorsal tegmental nuclei (dt). Low- to very-low-intensity signal is in glial cells of the white matter (*) and ependymal lining cells (arrowheads). E: Hindbrain. High-intensity signal is in neurons of the cerebellar Purkinje cell layer (arrowheads) and neurons of the brainstem (bs). F: Testis. Signal of moderate intensity is in seminiferous tubules (arrowheads). G and H: Uterus. Uterine stromal mucosal cells (us), negative with the sense riboprobe (G), show diffuse low signal with the antisense riboprobe (H). Very low signal is in mucosal glandular (mg) and epithelial cells (arrowheads). I and J: Heart/ventricle. Diffuse signal of moderate intensity relative to background levels in the sense control (I) is in cardiomyocytes (J). K and L: Paraspinal muscle. Low level signal above background levels (K) is in myocytes (L). M to P: Embryonic tissues, 16 day. M: Hypothalamus. Moderate level signal is in differentiating neurons (arrow). N: Inner ear. Moderate level signal is in the epithelial lining cells (arrow). O: Sympathetic ganglia. Moderate signal is in neurons (arrow). P: Testis. Moderate signal is in epithelial cells of the seminiferous tubules (arrow). Counterstaining is with H&E. Magnification, ×200 (A and B), ×100 (D and F–P), and ×40 (C and E).
Figure 2.
Figure 2.
Spatial and temporal expression of the mouse GAA mRNA by in situ hybridization. A: Bright-field image with H&E. B to K: Dark-field images for the sense (G, I, and K) and for the antisense (B–F, H, J, and L–P) 35S-labeled riboprobes. A to L: Adult tissues. High-intensity signal is present in neurons throughout the neuraxis (B–E). A and B: Cerebral cortex. Pyramidal and granule neurons (arrows) have large purple nuclei by H&E (A) and show high-intensity signal (B). Signal of lower intensity is in the molecular layer (m). Moderate-intensity signal is in meningeal cells of the pia mater-arachnoid (*). C: Cerebral sagittal section. Highest-intensity signals are in neurons of the hippocampus (arrows), cells lining the choroid plexus (arrowhead), and surrounding neuronal layers. D: Cerebrum/aqueduct of Sylvius. High-intensity signal is in neurons adjacent to the cerebral aqueduct (ca) located in the inferior colliculus nucleus (ic) and dorsal tegmental nuclei (dt). Low- to very-low-intensity signal is in glial cells of the white matter (*) and ependymal lining cells (arrowheads). E: Hindbrain. High-intensity signal is in neurons of the cerebellar Purkinje cell layer (arrowheads) and neurons of the brainstem (bs). F: Testis. Signal of moderate intensity is in seminiferous tubules (arrowheads). G and H: Uterus. Uterine stromal mucosal cells (us), negative with the sense riboprobe (G), show diffuse low signal with the antisense riboprobe (H). Very low signal is in mucosal glandular (mg) and epithelial cells (arrowheads). I and J: Heart/ventricle. Diffuse signal of moderate intensity relative to background levels in the sense control (I) is in cardiomyocytes (J). K and L: Paraspinal muscle. Low level signal above background levels (K) is in myocytes (L). M to P: Embryonic tissues, 16 day. M: Hypothalamus. Moderate level signal is in differentiating neurons (arrow). N: Inner ear. Moderate level signal is in the epithelial lining cells (arrow). O: Sympathetic ganglia. Moderate signal is in neurons (arrow). P: Testis. Moderate signal is in epithelial cells of the seminiferous tubules (arrow). Counterstaining is with H&E. Magnification, ×200 (A and B), ×100 (D and F–P), and ×40 (C and E).

Similar articles

Cited by

References

    1. Hers HG: α-Glucosidase in generalized glycogen-storage disease (Pompe’s disease). Biochem J 1963, 86:11-16 - PubMed
    1. Brown BI, Brown DH: The subcellular distribution of enzymes in type II glycogenosis and the occurrence of oligo α-1,4-glucan glucohydrolase in human tissues. Biochim Biophys Acta 1981, 110:124-133 - PubMed
    1. Hirschhorn R: Glycogen storage disease type II: acid α-glucosidase (acid maltase) deficiency. Scriver CR Beaudet AL Sly WL Valle D eds. The Metabolic and Molecular Bases of Inherited Disease. 1995, :pp 2443-2464 McGraw Hill, New York
    1. Mancall EL, Aponte GE, Berry RG: Pompe’s disease (diffuse glycogenosis) with neuronal storage. J Neuropathol Exp Neurol 1965, 24:85-96 - PubMed
    1. Hug G, Schubert WK: Glycogenosis type II. Arch Pathol 1967, 84:141-152 - PubMed

Publication types

LinkOut - more resources