. 1999 May 15;19(10):3900-17.
doi: 10.1523/JNEUROSCI.19-10-03900.1999.

Genesis, neurotrophin responsiveness, and apoptosis of a pronounced direct connection between the two eyes of the chick embryo: a natural error or a meaningful developmental event?

Affiliations

Genesis, neurotrophin responsiveness, and apoptosis of a pronounced direct connection between the two eyes of the chick embryo: a natural error or a meaningful developmental event?

S Thanos. J Neurosci. .

Abstract

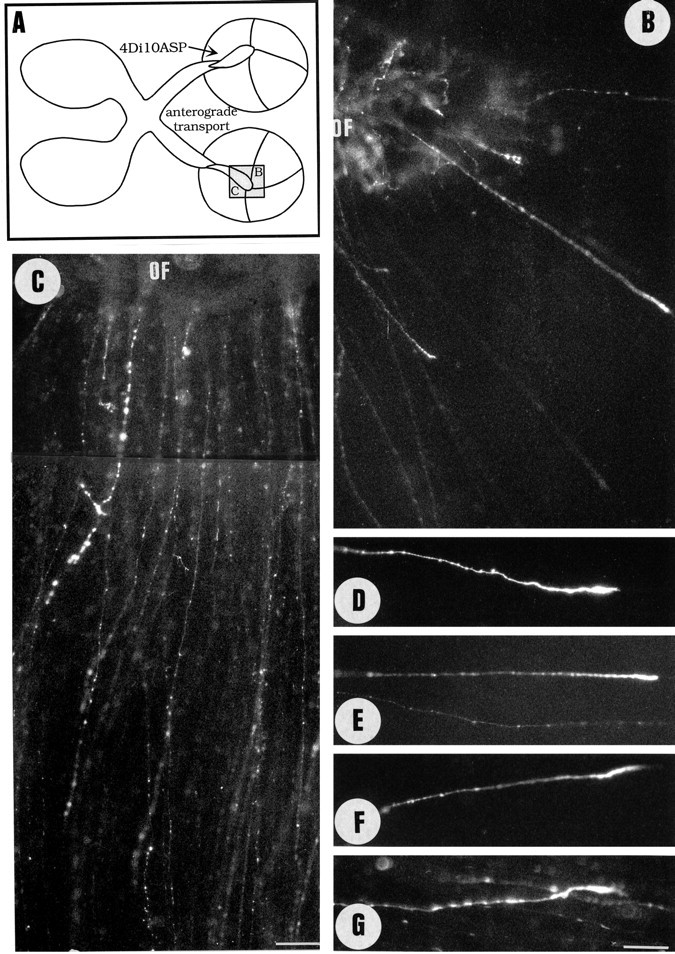
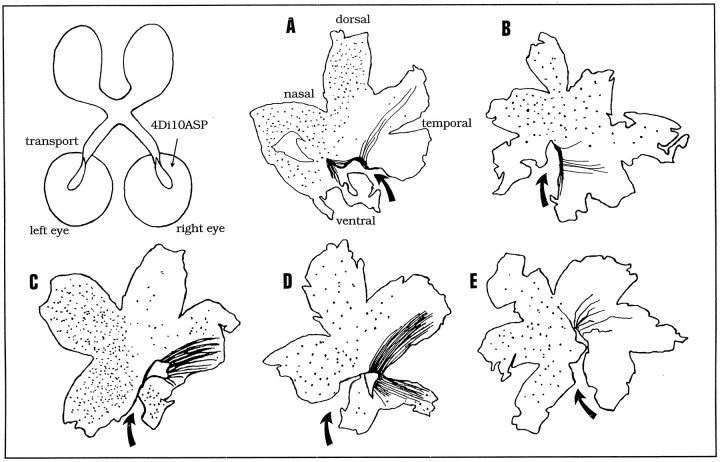
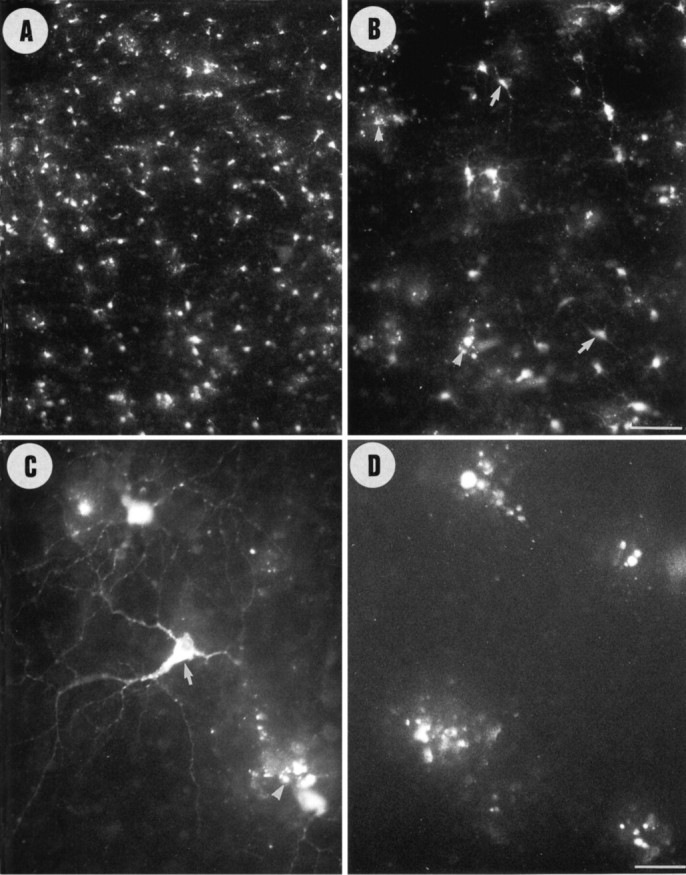
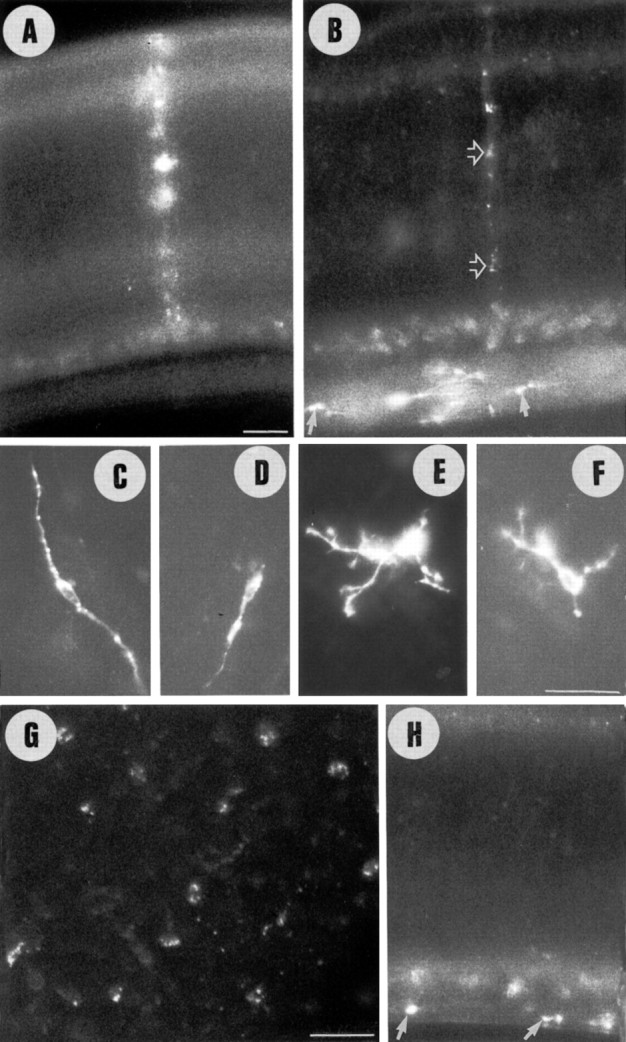
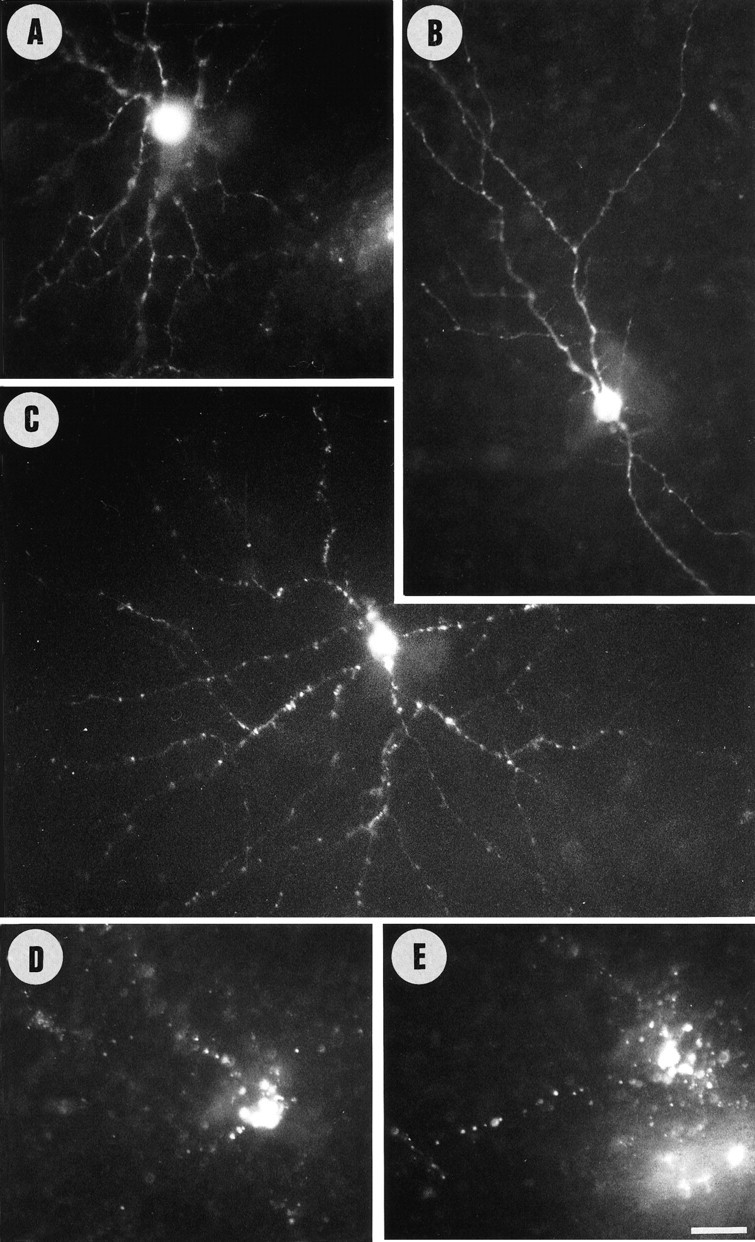
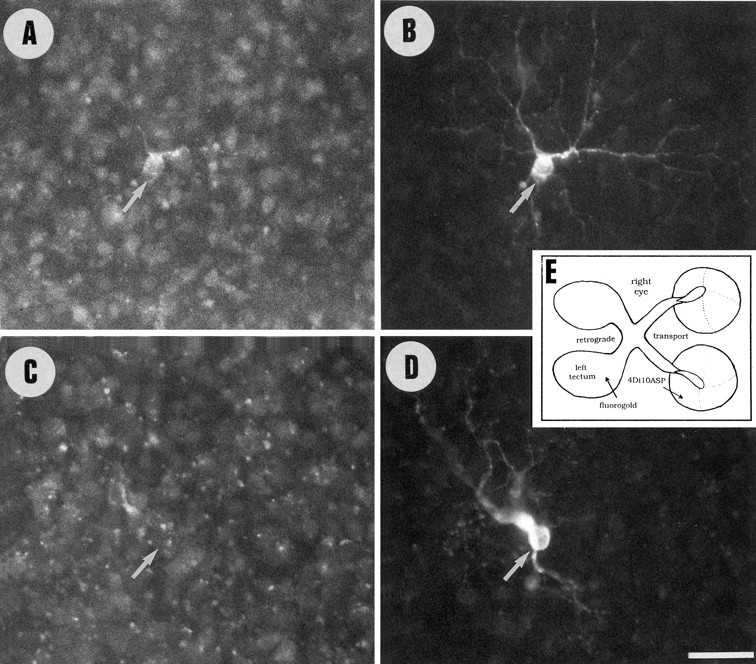
Unilateral intraocular injections of either of two fluorescent carbocyanine dyes into the embryonic chick eye resulted in both retrograde staining of ganglion cells (GCs) in the eye contralateral to site of injection and anterograde labeling of axons whose cell bodies were located within the injected eye. This prominent retino-retinal projection formed by thousands of GCs having a nasal origin and temporal termination appeared at embryonic day 6 (E6), attained its maximum intensity at E13-E14, and gradually disappeared until E18. The axonal growth cones ended superficially and never penetrated deeper layers of the retina. Treatment of the projection with BDNF resulted in massive terminal branching of the axons within deeper layers of the target retina. Double injection into the eye and the isthmo-optic nucleus showed a concomitant ingrowth of axons in the contralateral retina. Individual GCs died between E9 and E13, but massive apoptotic cell death was mainly monitored at E14 and later. Disintegrated cells showed typical images of apoptosis. Because degenerating cells were prelabeled with the membranophilic fluorescent carbocyanine dye, their death allowed the concomitant visualization of phagocytosing cells, too. Radial Müller glia were the only class of cells observed to become phagocytotic between E9 and E16. These cells became replaced exclusively with microglial cells from E17 on. The results suggest that the topologically restricted retino-retinal projection may have some developmental significance rather than representing a massive erroneous projection. Most likely, the projection may serve as a "template" to guide centrifugal isthmo-optic axons into the retina.


Figures

Fig. 1.
Fig. 1.
Labeling of the retino-fugal axons shows the major components of the chick visual system projections, as indicated in the schematic (D). Injection of 4Di-10ASP into the right eye at E4 resulted in anterograde labeling of axons in the anterior pole of the left tectum (A corresponds to intersection A of the diagram in D). As expected from former studies (O’Leary et al., 1983, Thanos and Bonhoeffer, 1984), axons were also labeled in the anterior pole of the ipsilateral tectum (B). C, Anterograde staining of axons (arrows) that terminate in the noninjected contralateral retina and of cell bodies (arrowheads) whose axons have reciprocally projected into the injected right retina. The optic fissure (OF) at the top is brightly fluorescent because of a background autofluorescence, which is independent of injection. Note that the anterogradely labeled axonal tips occupy the more temporal (te) half of the retina, whereas retrogradely filled ganglion cell bodies are predominantly in the nasal (na) part. D, Summarizing schematic showing the experimental setup and indicating the positions photographed in A–C. Scale bar, 100 μm.
Fig. 2.
Fig. 2.
Anterograde labeling of axons in the retino-retinal projection. A, Schematic showing that injection of 4DiI-10ASP into the left eye labels the axons entering the temporal contralateral retina. The intersections at the left optic fissure (OF) indicate the location ofB–D. B, Axons projecting from theOF toward the peripheral retina at E9. C, Large number of axons extending from the OF toward the temporal retinal periphery. D–G, Higher magnifications of axonal tips showing the typical growth cones within the retina contralateral to the dye injection. Scale bars: B, C, 50 μm; D–G, 25 μm.
Fig. 3.
Fig. 3.
Anterograde labeling of retino-retinal (A) and isthmo-retinal (B) axons in the flat-mounted right retina at E9. The photographs show the same retinal region close to the optic fissure (OF). Two of the retino-retinal axons (A) and one isthmo-optic axon (A, B, arrows) are in close vicinity to each other but are directed toward the retinal periphery. C–E, Typical intraretinal growth cones of isthmo-retinal axons labeled wtih 4Di-10ASP at E6 and observed in the whole-mounted retina at E9. Note the multiple filopodial protrusions. F, Typical isthmo-retinal terminal branching labeled with 4Di-10ASP at E6 and photographed at E13. Scale bars, 25 μm.
Fig. 4.
Fig. 4.
Fluorescence photomicrographs showing representative terminal arborizations of retinal axons within the target retina contralateral to the site of BDNF and dye injection at E16. A, Schematic showing the co-injection protocol of BDNF and 4Di-10ASP to visualize retino-retinal terminals. The retrogradely affected ganglion cell is shown in Figure11F. B–E, Retino-retinal terminals within the optic fiber layer (B), within the ganglion cell layer (C), and within the inner plexiform layer (D, E). The terminals possess several branches with multiple varicosities. F, Filopodial growth cones within the optic fiber layer. Scale bar, 25 μm.
Fig. 5.
Fig. 5.
Graphic representation of the axonal tips that form branches within the retina under control and BDNF conditions. There is virtually no arborization without BDNF (1.2 ± 0.6%) and little arborization when BDNF was injected into the target eye (8.1 ± 0.7%). Approximately half of the axons (48.0 ± 4.5%) formed elaborate branches within deeper layers when BDNF was injected into the eye of origin (compare with Fig.4A). Despite BDNF treatment, cell death eliminated most of the terminals at E18. The differences between treated and nontreated embryos were highly significant at the 95% confidence level (two-tailed Student’s ttest).
Fig. 6.
Fig. 6.
Camera lucida drawings of flat-mounted retinas showing the setup of the experiment (A) and five examples with injection performed at E10 and analyzed at E14 (B, D, E) and E16 (C, E). The dotted area indicates the location of retrogradely filled ganglion cell bodies, whereas lines indicate anterogradely labeled axons from the injected retina. Note that the cells are located predominantly within the nasal hemiretina, and axons are located within the temporal hemiretina. The arrow points to the ventrally located optic fissure.
Fig. 7.
Fig. 7.
Retrograde labeling of GCs contributing to the retino-retinal projection. A, Low-magnification fluorescence photomicrograph showing the cells labeled from E10 to E14 taken from the nasal retina shown in Figure 5C. Note the high density of cells. B, Higher magnification within the same area showing typical GCs (arrow) but also numerous apoptotic profiles (arrowheads).C) Higher magnification allows detailed identification of the living cells (arrow) and dying cells (arrowheads) at different stages of apoptotic degradation. D, Region with only silhouettes of dead cells with multiple apoptotic bodies at E16. Scale bar:A, 100; B, 50 μm; C, D, 25 μm.
Fig. 8.
Fig. 8.
Graph corroborating the proportion of apoptotic cells at three typical embryonic days of investigation in normal and BDNF-treated embryos. At all stages, BDNF reduced the proportion of apoptotic silhouettes but was unable to rescue cells beyond the period of cell death (E18). There was a significant difference (p < 0.01, Student’s ttest) between embryos that received BDNF in the retina analyzed at both P14 and P16 and those that received BDNF in the retina contralateral to analysis.
Fig. 9.
Fig. 9.
Apoptosis-dependent labeling of phagocytosing glial cells within the retina. A, Typical Müller cells associated with uptake of the fluorescent product at early stages of ganglion cell death (E14). B, Müller cells (arrowhead) and microglial cells (arrow) in the same section at E16. C, D, Ameboid microglial cells appearing within the nerve fiber layer at E16 and viewed in the whole-mounted retina. E, F, Ramified microglial cells in the ganglion cell layer at E16.G, Photograph taken from a nasal retinal whole mount after injection at E10 (before cell death) and examination at E18 (after cell death). Note the regular, typical distribution of microglial cells, which have been labeled after phagocytosis of GCs contributing to the retino-retinal projection. H, Section through the retina at E18 shows microglial cells (arrows) within the GCL and IPL. In all photographed sections OFL is toward the bottom. Scale bars: A–F, 25 μm; G, 50 μm.
Fig. 10.
Fig. 10.
Visualization of dendrito-genesis and -apoptosis within the retino-retinal projection. A,B, Typical dendrites at E9. C, Onset of karyo-apoptosis (condensed, irregularly shaped perikaryon) and dendrito-apoptosis (irregular varicosities, swellings along the branches) in a cell at E14. D, E, Advanced stages of apoptosis including both the perikarya and the dendrites at E14. Scale bar, 25 μm.
Fig. 11.
Fig. 11.
Branching patterns, sizes, and typification of GCs contributing to the retino-retinal projection at E16.A–C, Large cells with elaborate dendrites classified as group VII cells according to Vanselow et al. (1990). C,D, Small cells with small and bushy dendritic arbors corresponding to groups Ia and Ib. E, Large cell of group V with large dendrite and elaborate ramifications.F, Cell of group V after BDNF injection into the right eye and retrograde staining from left eye. Note the multiple spines along the dendritic branches. Scale bars: A–E, 50 μm; F, 25 μm.
Fig. 12.
Fig. 12.
The schematic inset(E) shows the experimental setup to label GCs, which may have formed two collaterals, one to the tectum (Fluorogold) and the other to the contralateral retina (4Di-10ASP).A, B, Same retinal region at E16 with Fluorogold-loaded GCs (A) from the tectum and one single ganglion cell (B) loaded with 4Di-10ASP from the contralateral retina. Arrows point to the position of this cell. Part of the cell is visible within the Fluorogold filter because of the selection of the emission window, but the cell is not double-labeled. C, D, Similar setup, with the single cell in D containing only 4Di-10ASP, thus indicating no collateral formation to the tectum, because it remained unlabeled with Fluorogold (arrows). Scale bar, 25 μm.
Fig. 13.
Fig. 13.
Summarizing presentation of the development and degeneration of the reciprocal retino-retinal projections in the chick embryo. A, Summary of the early stages (E6–E12) showing the central retino-fugal projections (blue) to the tecta, thalamus, and nucleus suprachiasmaticus (NS) and toward the area of ION (yellow). The reciprocal retino-retinal projections are marked in green andred and show from the beginning a hemiretinal topological projection from the nasal to the temporal half of the other site. B, At ∼E14, the retino-tectal topography is formed, the ipsilateral central retino-fugal projections degenerate, and the ION fibers have arrived at the retina. The retino-retinal axons are still present, whereas massive cell death occurs. C, At E16, microglial cells (pink) are labeled by phagocytosis, vital GCs have differentiated dendrites, and axons are still visible within the nasal part of the contralateral retina.D, At E18 and after hatching, the projections between the retinas disappear, and the only cells reminiscent of completed cell death are microglial cells. Persistent projections to and from the central targets display mature patterns.

Similar articles

Cited by

References

    1. Alvarez-Bolado G, Schwarz M, Gruss P. PAX-2 in the chiasm. Cell Tissue Res. 1997;290:197–200. - PubMed
    1. Apkarian P, Eckhardt PG, van-Schooneveld MJ. Detection of optic pathway misrouting in the human albino neonate. Neuropediatrics. 1991;22:211–215. - PubMed
    1. Barde YA, Edgar D, Thoenen H. Purification of a new neurotrophic factor from the mammalian brain. EMBO J. 1982;1:549–553. - PMC - PubMed
    1. Bohn RC, Stelzner DJ. The aberrant retino-retinal projection during optic nerve regeneration in the frog. I. Time course of formation and cells of origin. J Comp Neurol. 1981a;196:605–620. - PubMed
    1. Bohn RC, Stelzner DJ. The aberrant retino-retinal projection during optic nerve regeneration in the frog. II. Anterograde labelling with horseradish peroxidase. J Comp Neurol. 1981b;196:621–632. - PubMed

Publication types

MeSH terms

Substances