. 1999 May 15;19(10):3935-51.
doi: 10.1523/JNEUROSCI.19-10-03935.1999.

Segmentation by color influences responses of motion-sensitive neurons in the cortical middle temporal visual area

Affiliations

Segmentation by color influences responses of motion-sensitive neurons in the cortical middle temporal visual area

L J Croner et al. J Neurosci. .

Abstract

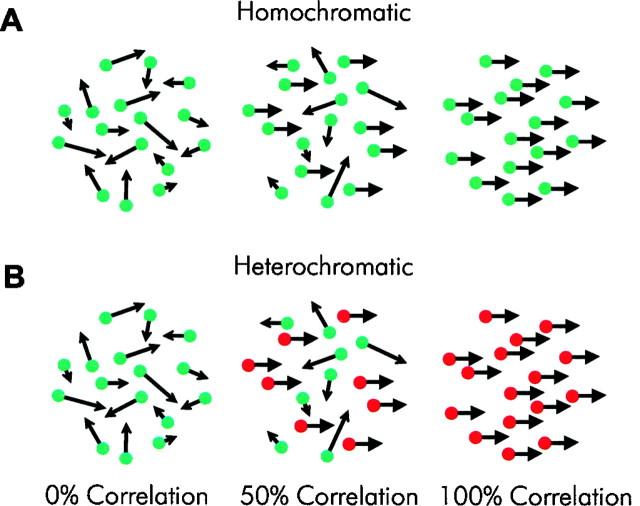
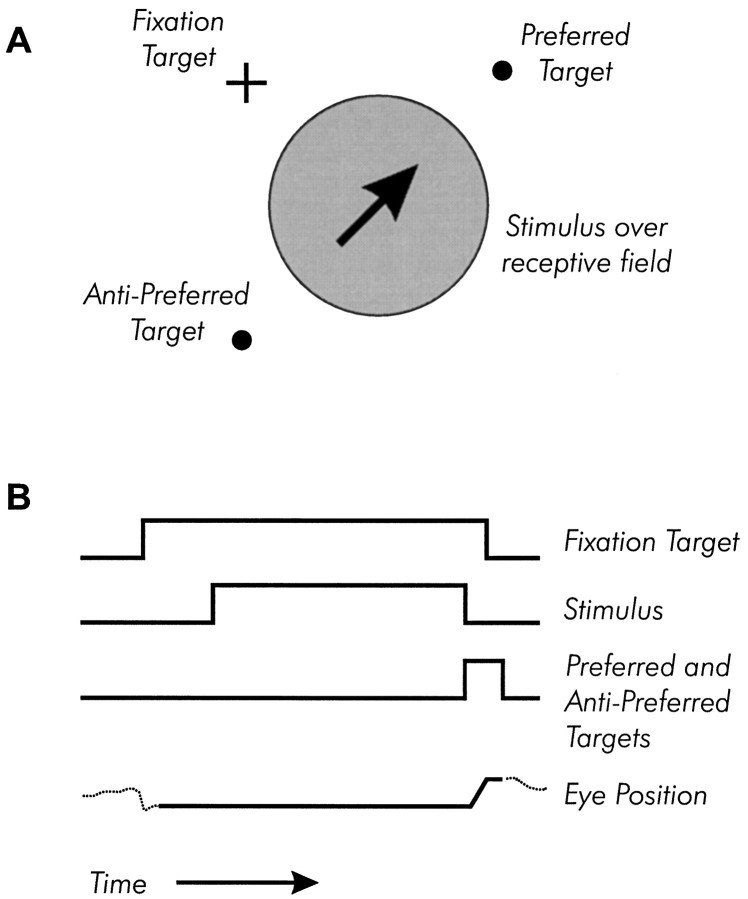
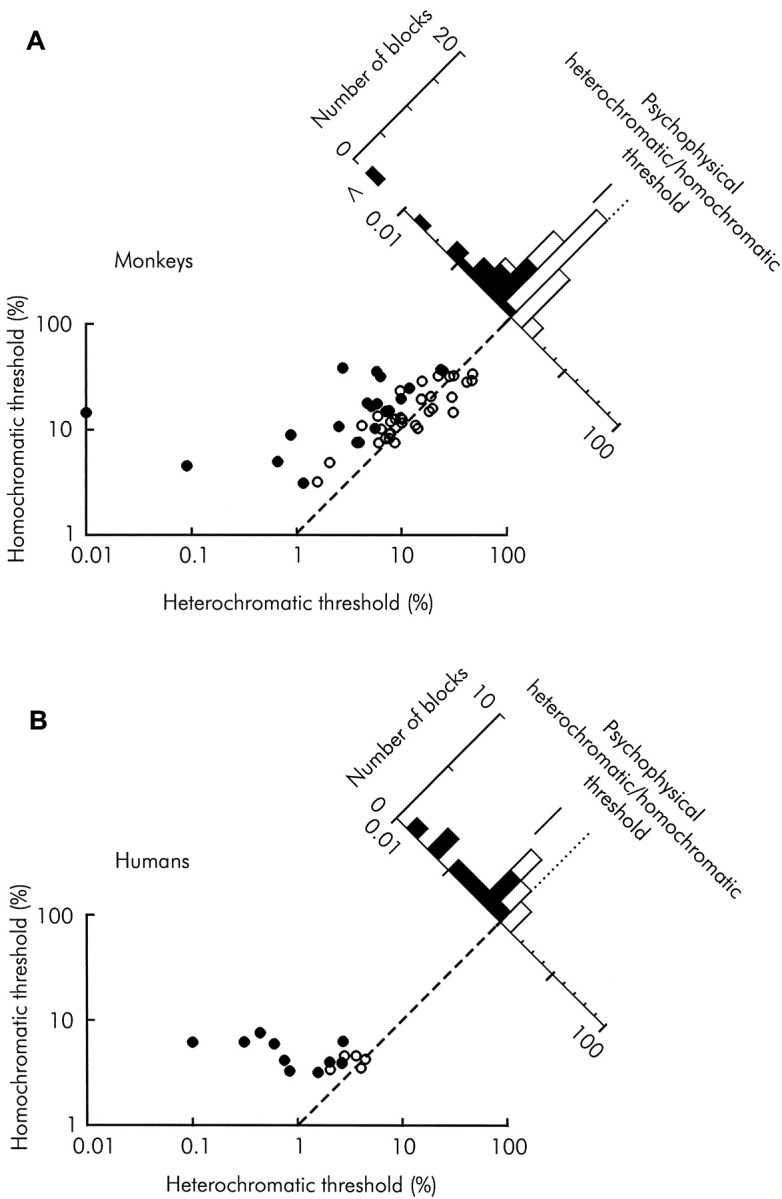
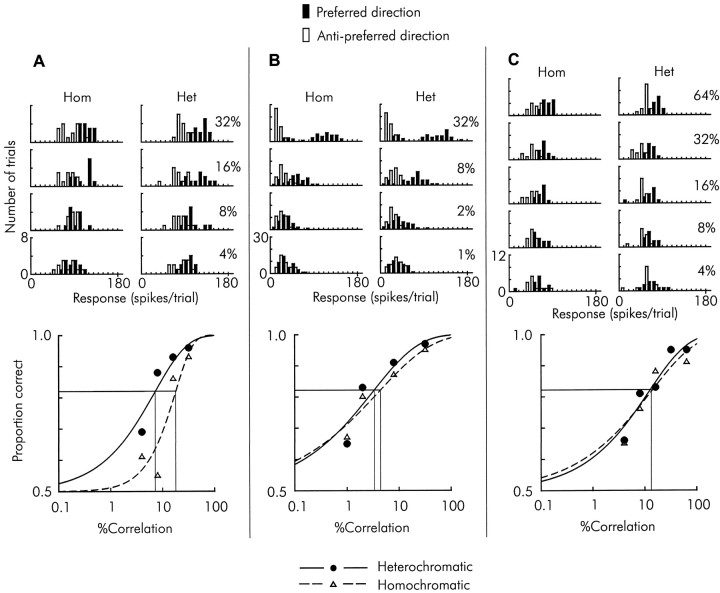
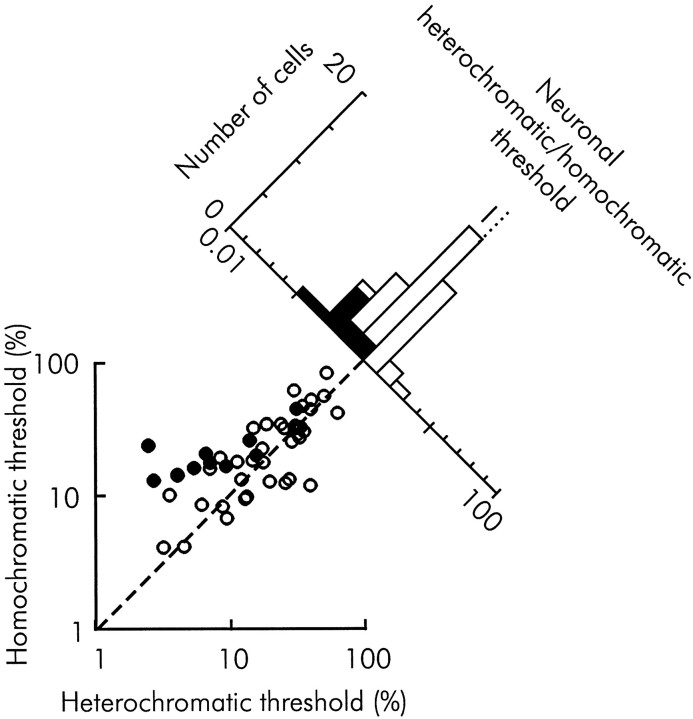
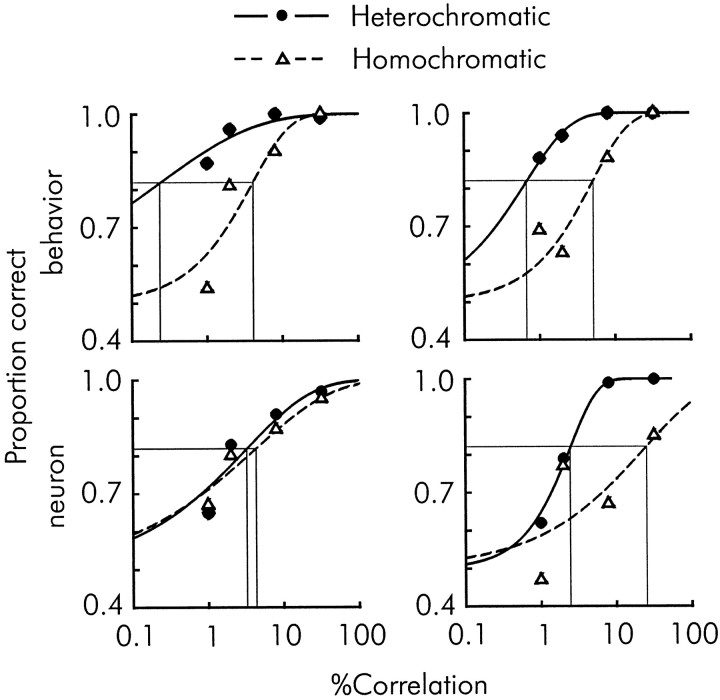
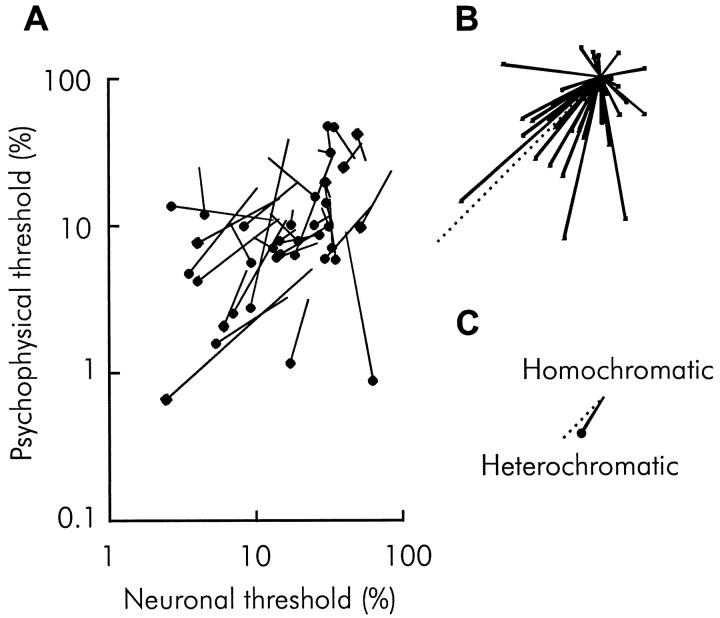
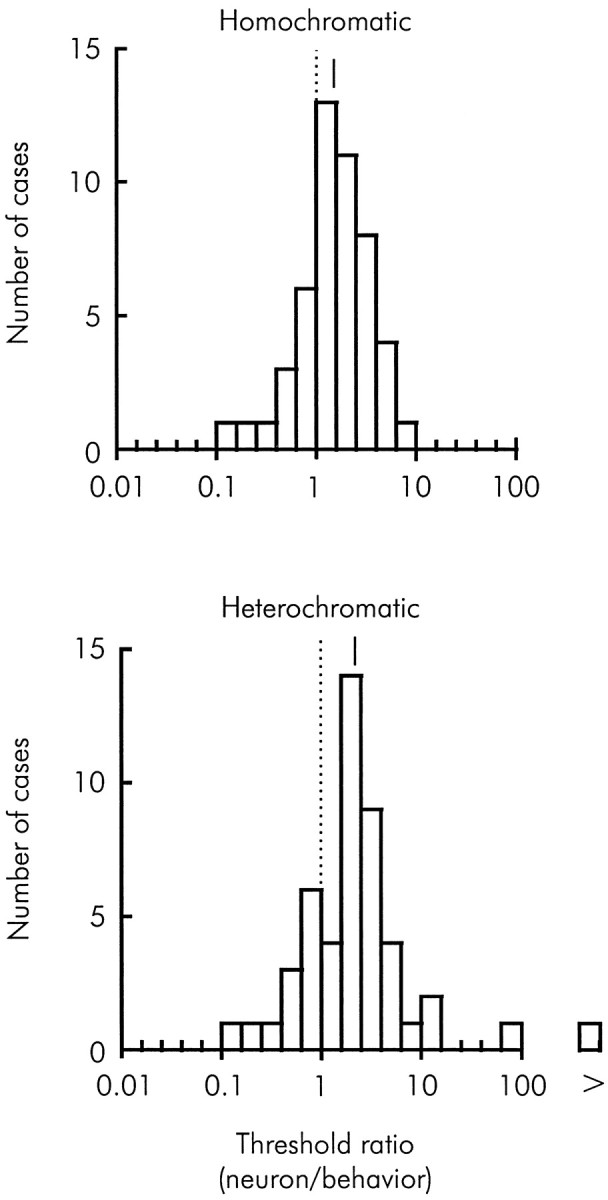
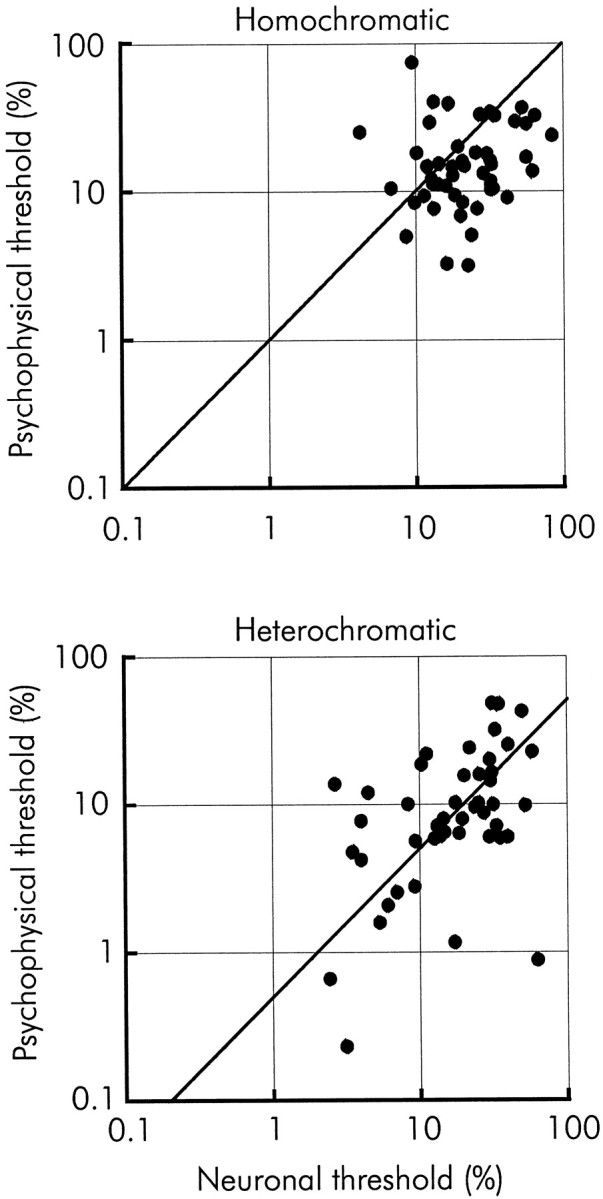
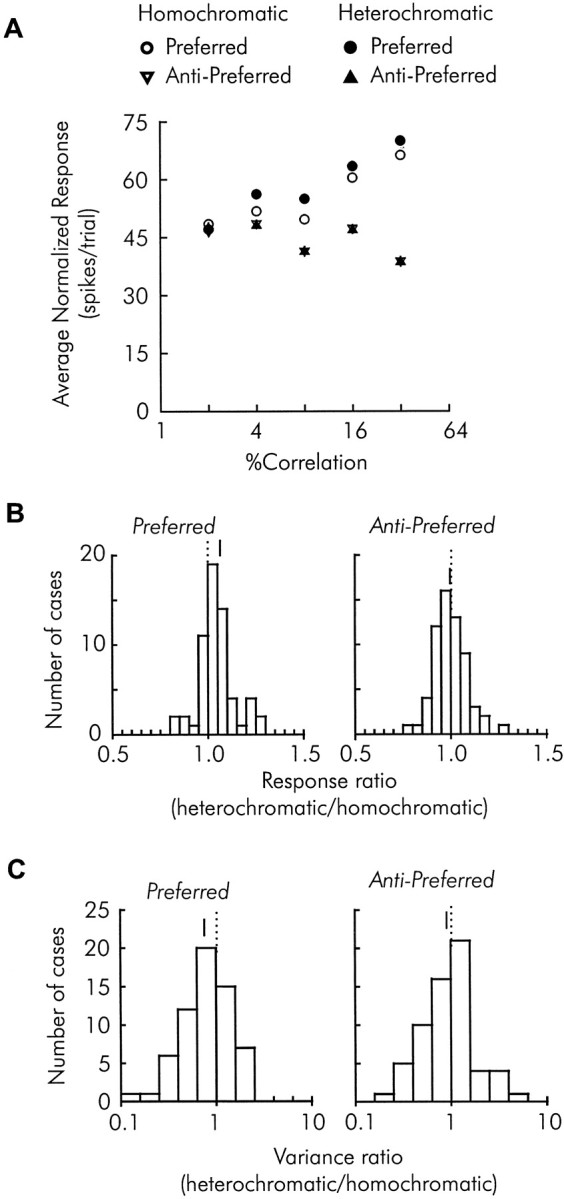
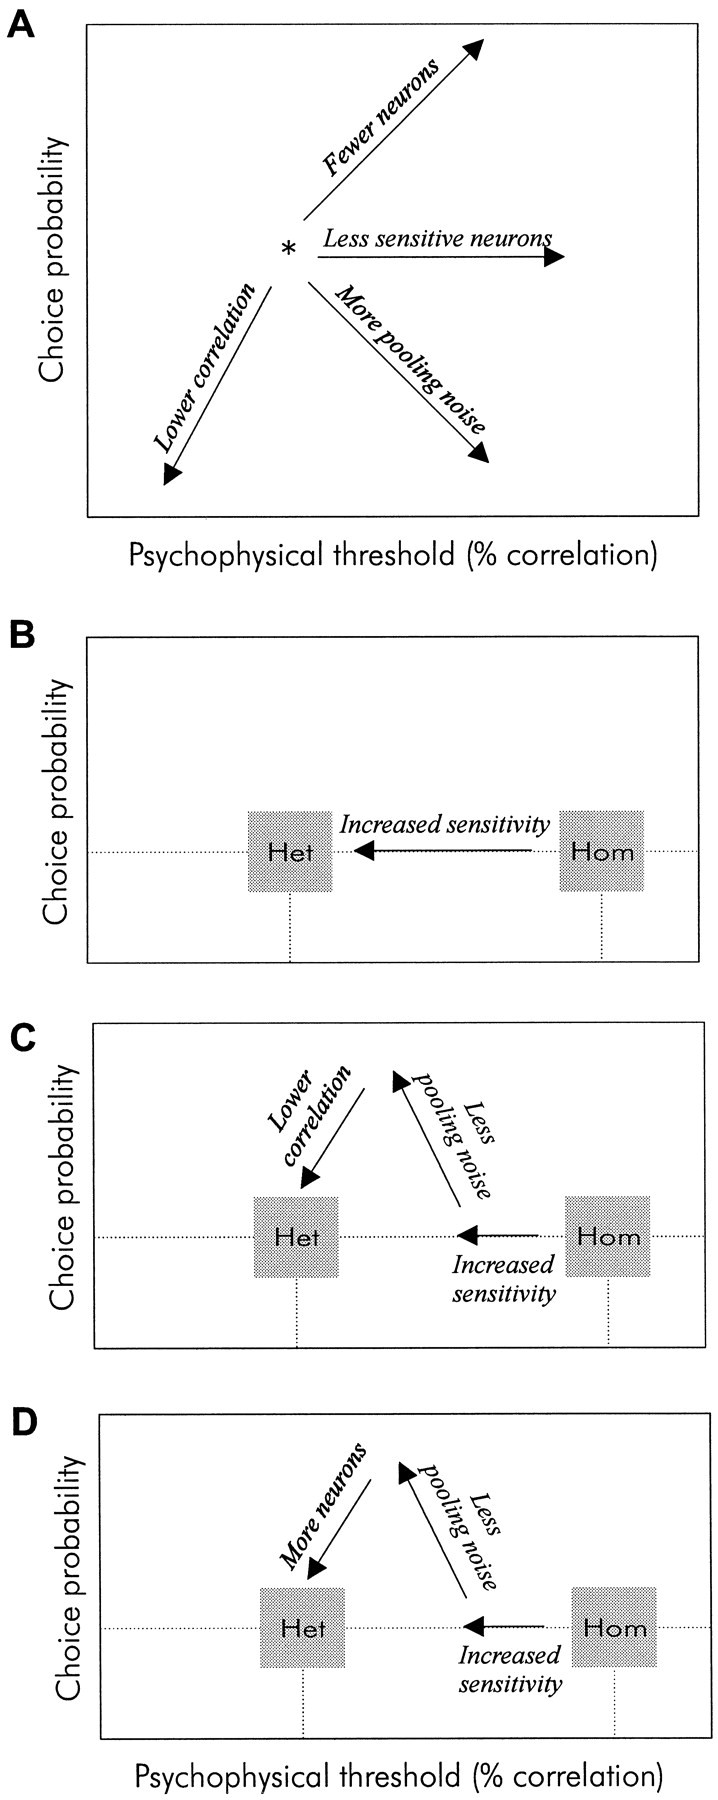
We previously showed that human subjects are better able to discriminate the direction of a motion signal in dynamic noise when the signal is distinguished (segmented) from the noise by color. This finding suggested a hitherto unexplored avenue of interaction between motion and color pathways in the primate visual system. To examine whether chromatic segmentation exerts a similar influence on cortical neurons that contribute to motion direction discrimination, we have now compared the discriminative capacity of single MT neurons and psychophysical observers viewing motion signals with and without chromatic segmentation. All data were obtained from rhesus monkeys trained to discriminate motion direction in dynamic stimuli containing varying proportions of coherently moving (signal) and randomly moving (noise) dots. We obtained psychophysical and neurophysiological data in the same animals, on the same trials, and using the same visual display. Chromatic segmentation of the signal from the noise enhanced both neuronal and psychophysical sensitivity to the motion signal but had a smaller influence on neuronal than on psychophysical sensitivity. Hence the ratio of neuronal to psychophysical thresholds, one measure of the relation between neuronal and psychophysical performance, depended on chromatic segmentation. Increased neuronal sensitivity to chromatically segmented displays stemmed from larger and less noisy responses to motion in the preferred directions of the neurons, suggesting that specialized mechanisms influence responses in the motion pathway when color segments motion signal in visual scenes. These findings lead us to reevaluate potential mechanisms for pooling of MT responses and the role of MT in motion perception.


Figures

Fig. 1.
Fig. 1.
Schematic diagram of the motion stimuli used in this study. Each stimulus consisted of a sequence of frames of randomly positioned dots appearing on a CRT screen. Dots in each of the six circular apertures of the figure represent dots in six different stimuli. Arrows show the location of each dot in the next step of the motion sequence and so represent velocity (direction and speed). The proportion of dots moving in the same direction at the same speed, expressed as a percentage and termed the “correlation”, describes the strength of the motion signal. At 0% correlation, all of the dots are replotted at random positions, generating a purely stochastic motion display. At 50% correlation, half of the dots (those with larger arrowheads) are replotted at a fixed offset. At 100% correlation, all of the dots are replotted with the same offset. A, In the conventional “homochromatic” condition, all of the dots have the same color (green). B, In the novel “heterochromatic” condition, the dots moving in a correlated manner are a different color (red) from those moving randomly (green).
Fig. 2.
Fig. 2.
Diagram of the psychophysical paradigm used in this study. A, Example spatial configuration of the fixation target, stimulus aperture, and targets for direction choice. The stimulus aperture diameter was matched to the receptive field diameter of the neuron under study, and the fixation target was positioned separately for each neuron to center the receptive field on the stimulus aperture, which was at the center of the video display. Signal motion during each trial was in either the preferred or antipreferred direction of the neuron; the targets for direction choice were positioned according to the preferred direction of the neuron.B, Diagram of the temporal sequence of events during one trial. A trial was initiated with the onset of the fixation target (Fixation Target). Five hundred milliseconds after fixation was achieved (Eye Position), the motion stimulus was presented for 2 sec (Stimulus). When the stimulus was extinguished, the Preferred andAntiPreferred Targets appeared and remained on until the monkey indicated its direction choice by making a saccadic eye movement to one of them.
Fig. 3.
Fig. 3.
Example psychometric functions. Each plot shows data obtained in a single block of randomly interleaved homochromatic and heterochromatic trials. The inset to theright of each plot gives the retinal eccentricity of the stimulus and the axis of signal direction used in each block. The data are plotted as the proportion of correct direction decisions against the stimulus correlation level (homochromatic, white triangles; heterochromatic, black circles), and are fit with Quick functions (see Materials and Methods) (homochromatic, dashed lines; heterochromatic,solid lines). In each plot, a thin horizontal line is drawn through threshold performance (0.82). Where this line intersects each psychometric function, a thin vertical line is drawn to intersect the x-axis at the threshold correlation of the function. The homochromatic and heterochromatic psychophysical thresholds, respectively, were 29.7 and 13.2% (32–37 trials per point) (top), 23.5 and 10.9% (32–37 trials per point) (middle), and 9.5 and 2.9% (40–44 trials per point) (bottom).
Fig. 4.
Fig. 4.
Comparison of behavioral performance for the homochromatic and heterochromatic conditions. The bottom panels in A and B show scatterplots of the absolute thresholds obtained in single blocks of trials. The black symbols signify blocks in which the two thresholds were significantly different from each other, evaluated as described in the Materials and Methods; the broken lines illustrate where points would fall if the thresholds were identical. The top right panels in A andB show frequency distributions of the ratios of heterochromatic to homochromatic thresholds obtained in single blocks of trials, formed by summing across the scatterplots within diagonally oriented bins. Dotted lines indicate unity, andsolid line segments are aligned with the geometric means. Ratios less than unity indicate that behavioral performance was better (threshold was lower) for the heterochromatic condition. Theblack bars show the threshold ratios for blocks in which the two behavioral thresholds were significantly different from each other. A, Thresholds and threshold ratios obtained from monkeys. The data were obtained during our neurophysiological experiments and are the 54 cases for which we obtained good fits of the Quick function to behavioral data for both the homochromatic and heterochromatic conditions. The impact of the outlier (threshold ratio < 0.01) on the threshold ratio distribution was minimal: omitting this datum did not significantly affect the geometric mean of the distribution, nor did it affect the significant difference of the geometric mean from 1.0. B, Thresholds and threshold ratios obtained from humans. Shown are 16 cases obtained from block-by-block analysis of data from previously published experiments (Croner and Albright, 1997).
Fig. 5.
Fig. 5.
Representative neuronal responses to homochromatic and heterochromatic stimuli, and the resulting neurometric functions. The top panels show frequency distributions of responses (number of spikes per 2 sec random dot stimulus) to two directions of stimulus motion [preferred (black bars) and antipreferred (white bars)], two stimulus conditions [homochromatic, Hom (left column) and heterochromatic, Het (right column)], and four or five stimulus correlation levels (increasing fromtop to bottom). The bottom panels show the resulting neurometric functions; the proportion of correct decisions based on neuronal responses is plotted against stimulus correlation (homochromatic, white triangles; heterochromatic, black circles), and Quick functions are fitted to the data (homochromatic, dashed lines; heterochromatic, solid lines). Thin straight lines illustrate thresholds, as in Figure 3. A,An experiment in which we measured significantly different neuronal thresholds for the homochromatic and heterochromatic conditions. The homochromatic and heterochromatic thresholds, respectively, were 17.6 and 7.0% (24–29 trials per point). B, An experiment with a different neuron, whose thresholds for the two conditions were statistically indistinguishable. Neuronal performance was generally better for the heterochromatic condition, and the heterochromatic threshold was slightly lower. The homochromatic and heterochromatic thresholds, respectively, were 4.1 and 3.1% (80–85 trials per point).C, An experiment with a neuron that showed no consistent difference in discriminability of the two conditions and with homochromatic and heterochromatic thresholds that were statistically indistinguishable. The homochromatic and heterochromatic thresholds, respectively, were 13.2 and 12.0% (the average threshold of 12.6% is illustrated) (24–29 trials per point).
Fig. 6.
Fig. 6.
Comparison of neuronal performance for the homochromatic and heterochromatic conditions. The bottom panel shows a scatterplot of the absolute thresholds obtained in experiments with single neurons. The black symbolssignify neurons for which the two thresholds were significantly different from each other; the broken line illustrates where points would fall if the thresholds were identical. Thetop right panel shows a frequency distribution of the ratios of heterochromatic to homochromatic thresholds, formed by summing across the scatterplot within diagonally oriented bins. Thedotted line indicates unity, and the solid line segment is aligned with the geometric mean. Ratios less than unity indicate that neuronal performance was better (threshold was lower) for the heterochromatic condition. The black barsshow the threshold ratios for experiments in which the two thresholds were significantly different from each other. The data are from the 50 experiments for which we obtained good fits of the Quick function to neuronal data for both conditions.
Fig. 7.
Fig. 7.
Psychometric and neurometric functions obtained in two experiments. The psychometric functions are shown in the top panels, and the corresponding neurometric functions obtained at the same time are shown in the bottom panels. Homochromatic: white triangles, dashed lines; heterochromatic: black circles,solid lines. The left column shows an experiment in which color segmentation had a large, statistically significant effect on behavioral performance (behavioral thresholds: homochromatic, 3.98%; heterochromatic, 0.23%), but only a small effect on neuronal performance measured at the same time (neuronal thresholds: homochromatic, 4.1%; heterochromatic, 3.1%, not statistically different) (80–85 trials per point). The right column shows an experiment in which a large (∼10-fold), statistically significant decrease in the behavioral heterochromatic threshold (thresholds: homochromatic, 5.0%; heterochromatic, 0.7%) was accompanied by a large (∼10-fold), statistically significant decrease in the neuronal heterochromatic threshold (thresholds: homochromatic, 23.8%; heterochromatic, 2.4%) (16–20 trials per point). (Note: the data in the left column are from the same experiment as in Fig. 5B.)
Fig. 8.
Fig. 8.
Comparison of the change in absolute neuronal and behavioral thresholds afforded by color segmentation. A,Vectors show the change in thresholds measured in each experiment. Theplain end of each vector shows the relation between behavioral and neuronal thresholds for the homochromatic condition, and the end with a black dot shows the same relation for the heterochromatic condition. Vectors with a downwardcomponent (from homochromatic to heterochromatic) indicate enhanced behavioral sensitivity to the heterochromatic condition; vectors with an upward component indicate the converse. Vectors with a leftward component indicate enhanced neuronal sensitivity to the heterochromatic condition; vectors with arightward component indicate the converse.B, The vectors are redrawn from the same origin, which represents the homochromatic thresholds. C, The single vector is the average of the vectors shown in B. InB and C the dotted line is the 45° diagonal, where vectors would lie if color segmentation influenced behavioral and neuronal thresholds equally.
Fig. 9.
Fig. 9.
Relative sensitivity of single MT neurons and monkeys. The frequency distributions show the ratio of neuronal threshold to behavioral threshold for the homochromatic (top) and heterochromatic (bottom) conditions. Dotted vertical lines indicate unity, andsolid vertical line segments are aligned with the geometric means. The ratios are from experiments in which we obtained good fits of the Quick function to both neuronal and behavioral data (homochromatic, 49 experiments; heterochromatic, 48 experiments). The impact of the outlier (threshold ratio > 100) on the heterochromatic distribution was minimal: omitting this datum did not significantly affect the geometric mean of the distribution, nor did it affect the significant difference of the geometric mean from 1.0 or from the geometric mean of the homochromatic distribution.
Fig. 10.
Fig. 10.
Comparison of absolute neuronal and behavioral thresholds. For the homochromatic data (top), thesolid diagonal line represents equality, where points would lie if behavioral threshold equaled neuronal threshold. For the heterochromatic data (bottom), the solid diagonal line represents where points would lie if behavioral threshold were exactly half of neuronal threshold (that is, if behavioral discrimination were twice as sensitive as neuronal discrimination).
Fig. 11.
Fig. 11.
Schematic diagram of response changes that would result in enhanced neuronal discriminability for the heterochromatic condition. Shown are hypothetical frequency distributions of the responses of one neuron to a stochastic motion stimulus of one correlation level, with motion in the preferred or antipreferred direction of the neuron. Hypothetical responses to homochromatic (solid lines) and heterochromatic (dashed lines) stimuli are shown. Improved discriminability based on neuronal responses would result from a change that decreased the overlap of preferred and antipreferred response distributions.A, Heterochromatic stimuli could evoke responses that differ in magnitude from responses to homochromatic stimuli.B, Heterochromatic stimuli could evoke responses that are less variable than responses to homochromatic stimuli.
Fig. 12.
Fig. 12.
Relative parameters of response distributions for homochromatic and heterochromatic conditions. A, To convey the difference between the magnitude of responses to homochromatic and heterochromatic stimuli, average normalized responses to homochromatic (white symbols) and heterochromatic (black symbols) stimuli have been scaled and plotted against stimulus correlation. Preferred direction (circles) and antipreferred direction (triangles) responses are shown. For each neuron, the average responses to preferred and antipreferred directions of homochromatic and heterochromatic stimuli of each stimulus correlation were determined. These averages were normalized by the average response of the neuron to preferred direction heterochromatic stimuli of that correlation level and then averaged across neurons. The processed responses were then multiplied by the average of the heterochromatic responses of all the neurons to a given correlation. B,Frequency distributions showing the ratios of raw average heterochromatic to homochromatic responses for preferred (left) and antipreferred (right) direction motion. Dotted vertical lines indicate unity, and solid vertical line segments are aligned with the means. The means of the two distributions are significantly different (one-sample ttest; p < 0.001). C, Frequency distributions showing the ratios of heterochromatic response variance to homochromatic response variance for preferred (left) and antipreferred (right) direction motion.Dotted vertical lines indicate unity, and solid vertical line segments are aligned with the means. The means of the two distributions are significantly different (one-samplet test; p = 0.044).
Fig. 13.
Fig. 13.
Schematic diagrams showing the response changes associated with enhanced discriminability by neurons with significantly different homochromatic and heterochromatic thresholds.A, Hypothetical frequency distributions of the responses of a neuron to homochromatic stimuli (solid lines) and to heterochromatic (dashed lines) preferred direction stimuli of one stimulus correlation. B, Hypothetical frequency distributions of the responses of a neuron to homochromatic stimuli of a low stimulus correlation (solid lines) and to homochromatic stimuli of twice that correlation (dashed lines).
Fig. 14.
Fig. 14.
Neuronal choice probability for preferred direction motion. Black bars show neurons whose choice probabilities were significantly different from chance, according to the permutation test described by Britten et al. (1996). Dotted vertical lines indicate chance, and solid vertical line segments are aligned with the means. A,Distribution of choice probabilities calculated from responses to homochromatic stimuli. B, Distribution of choice probabilities calculated from responses to heterochromatic stimuli.
Fig. 15.
Fig. 15.
How the Shadlen et al. (1996) MT pooling model could account for enhanced behavioral threshold with color segmentation. A, The model predicted average neuronal choice probability and behavioral thresholds, which define a two-dimensional space, depending on the state of four model parameters: number of neurons pooled, sensitivity of the neurons, pooling noise, and correlation between neurons. Asterisk indicates an arbitrary relation between choice probability and behavioral threshold.Arrows indicate how changes in each of the four parameters would affect the simulated choice probability and threshold. (Shadlen et al. 1996, their Fig. 8).BD, Gray boxes represent our data for the homochromatic (Hom) and heterochromatic (Het) conditions. Behavioral thresholds were lower for the heterochromatic condition, and choice probability was the same for both conditions.B, Pooled neurons with sufficiently enhanced sensitivity for the heterochromatic condition could account for our data.C, Pooling of neurons with slightly enhanced heterochromatic sensitivity could account for our data if there were less pooling noise and lower correlation between individual neurons.D, Pooling of neurons with slightly enhanced heterochromatic sensitivity could also account for our data if there were less pooling noise as well as larger pools.

Similar articles

Cited by

References

    1. Abramov I, Gordon J, Chan H. Color appearance in the peripheral retina: effects of stimulus size. J Opt Soc Am A. 1991;8:404–414. - PubMed
    1. Britten KH, Shadlen MN, Newsome WT, Movshon JA. The analysis of visual motion: a comparison of neuronal and psychophysical performance. J Neurosci. 1992;12:4745–4765. - PMC - PubMed
    1. Britten KH, Shadlen MN, Newsome WT, Movshon JA. Responses of neurons in macaque MT to stochastic motion signals. Vis Neurosci. 1993;10:1157–1169. - PubMed
    1. Britten KH, Newsome WT, Shadlen MN, Celebrini S, Movshon JA. A relationship between behavioral choice and the visual responses of neurons in macaque MT. Vis Neurosci. 1996;13:87–100. - PubMed
    1. Buračas GT, Albright TD. Neural correlates of target detection during visual search in area MT. Soc Neurosci Abstr. 1995;21:1759.

Publication types

LinkOut - more resources