. 1999 May 15;19(10):3992-4010.
doi: 10.1523/JNEUROSCI.19-10-03992.1999.

Precisely synchronized oscillatory firing patterns require electroencephalographic activation

Affiliations

Precisely synchronized oscillatory firing patterns require electroencephalographic activation

S Herculano-Houzel et al. J Neurosci. .

Abstract

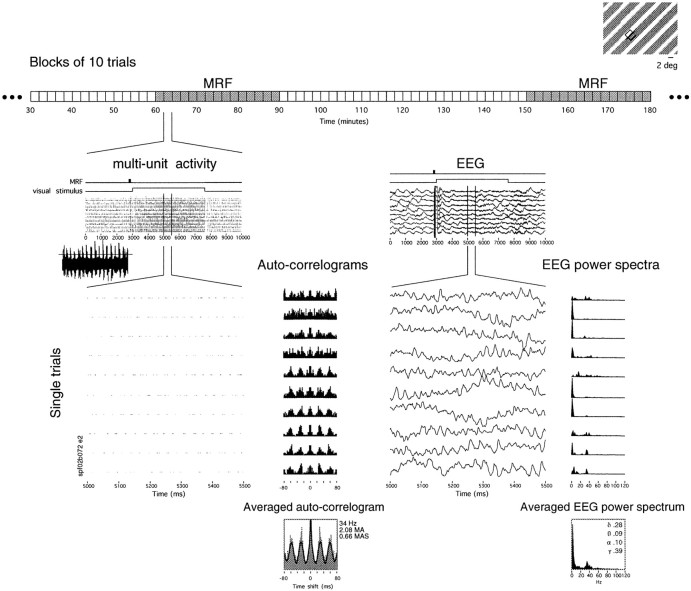
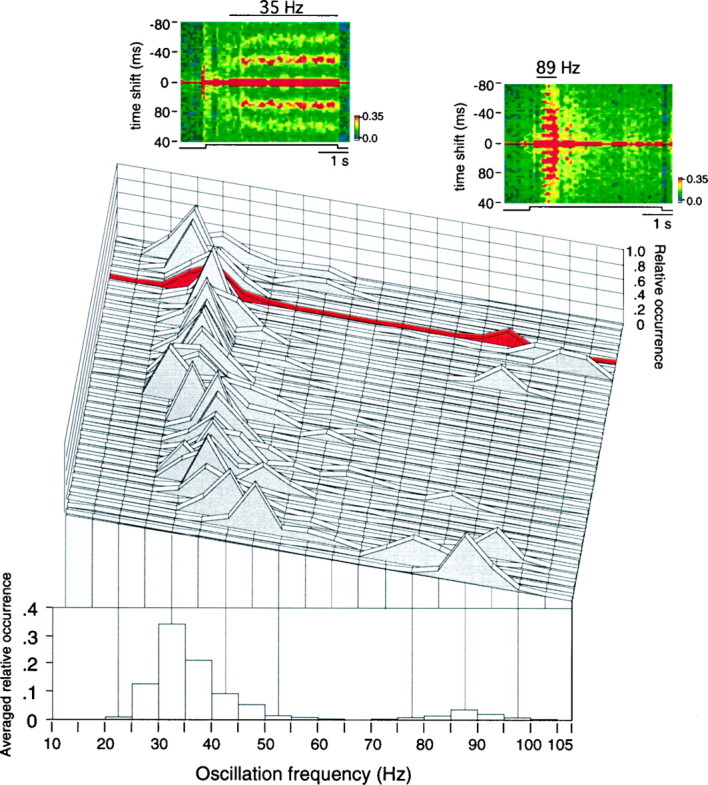
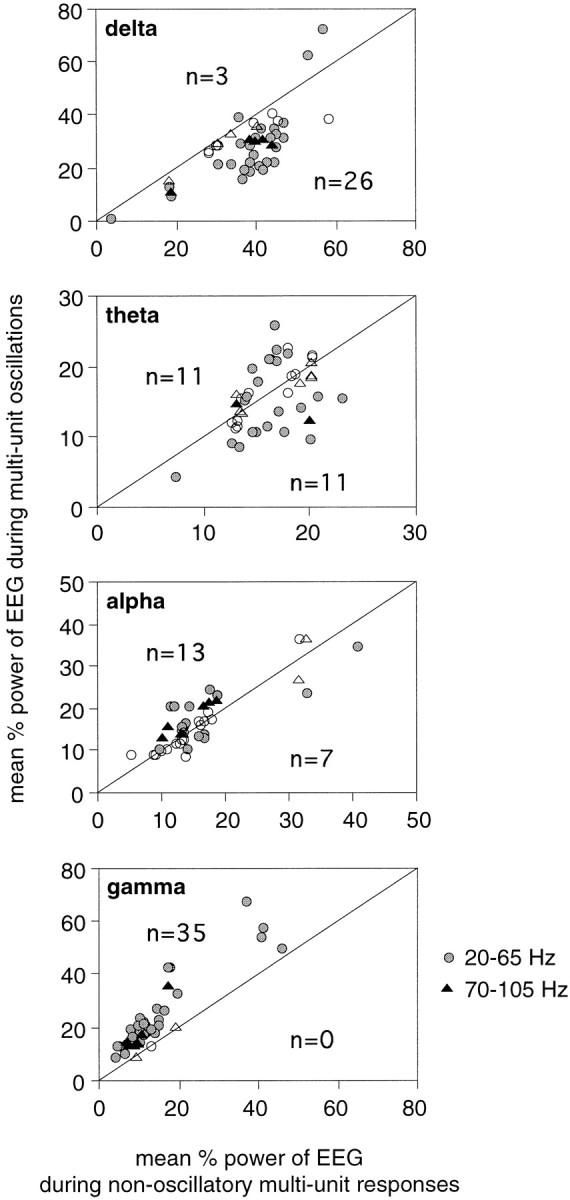
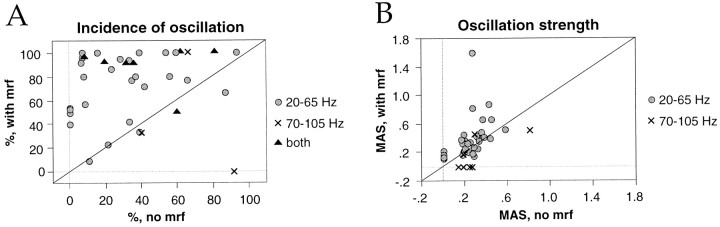
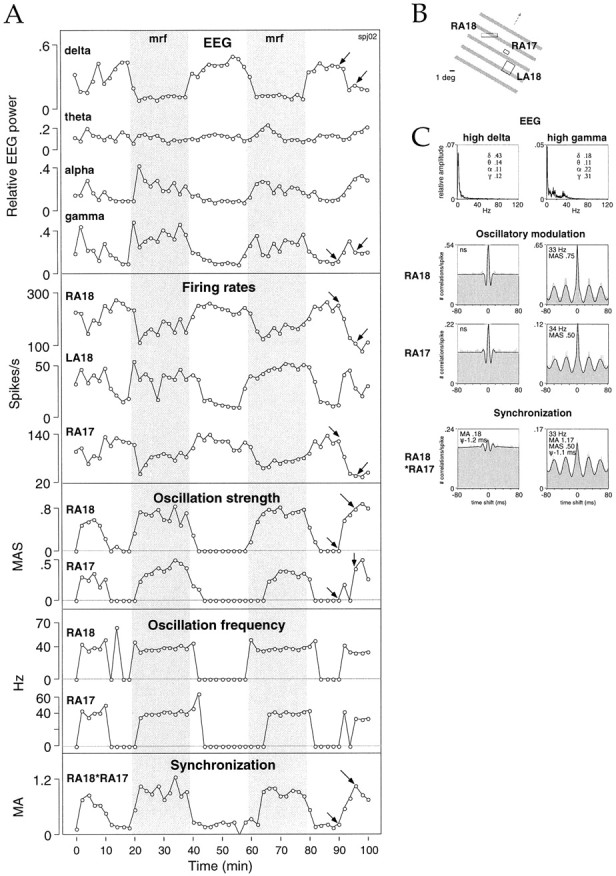
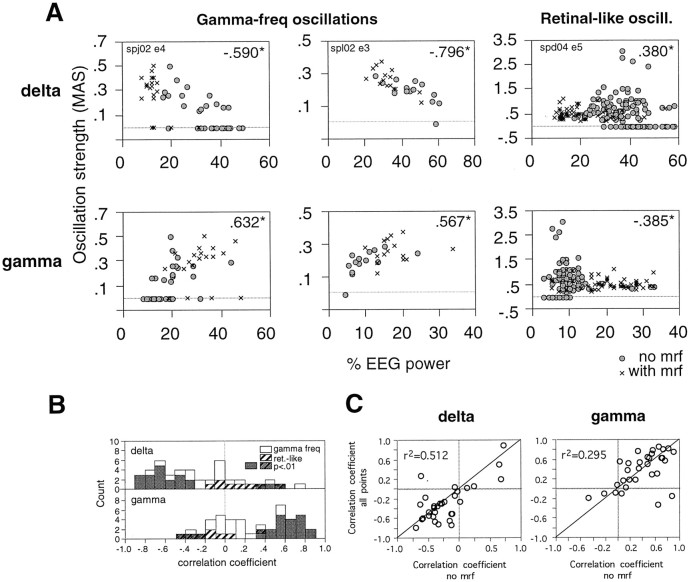
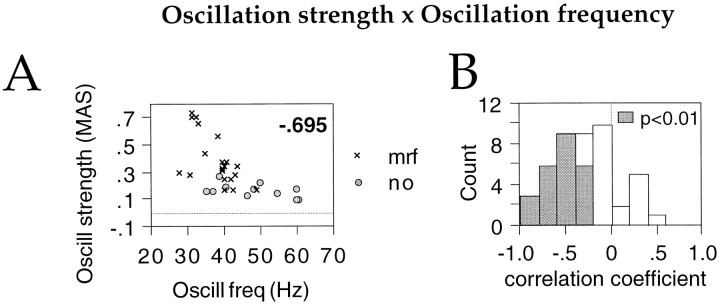
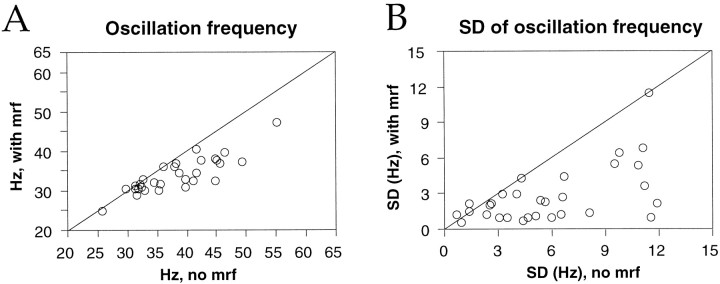
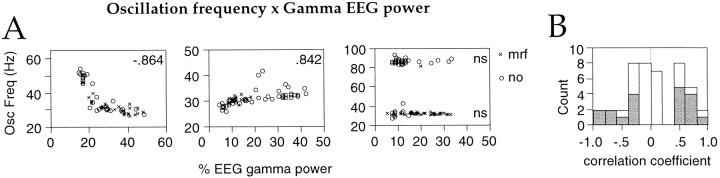
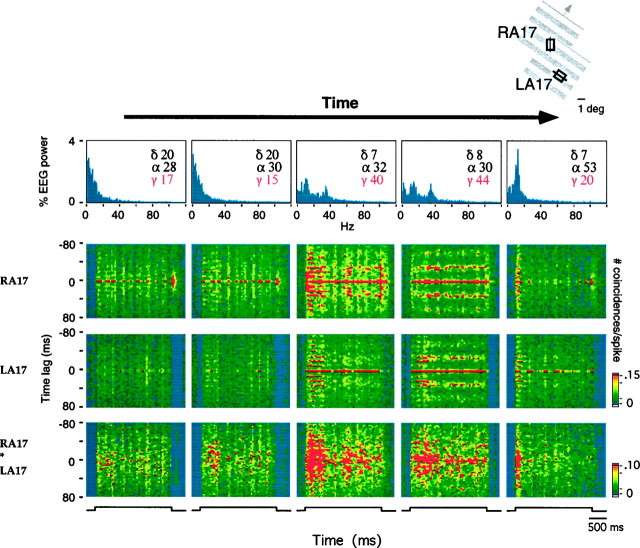
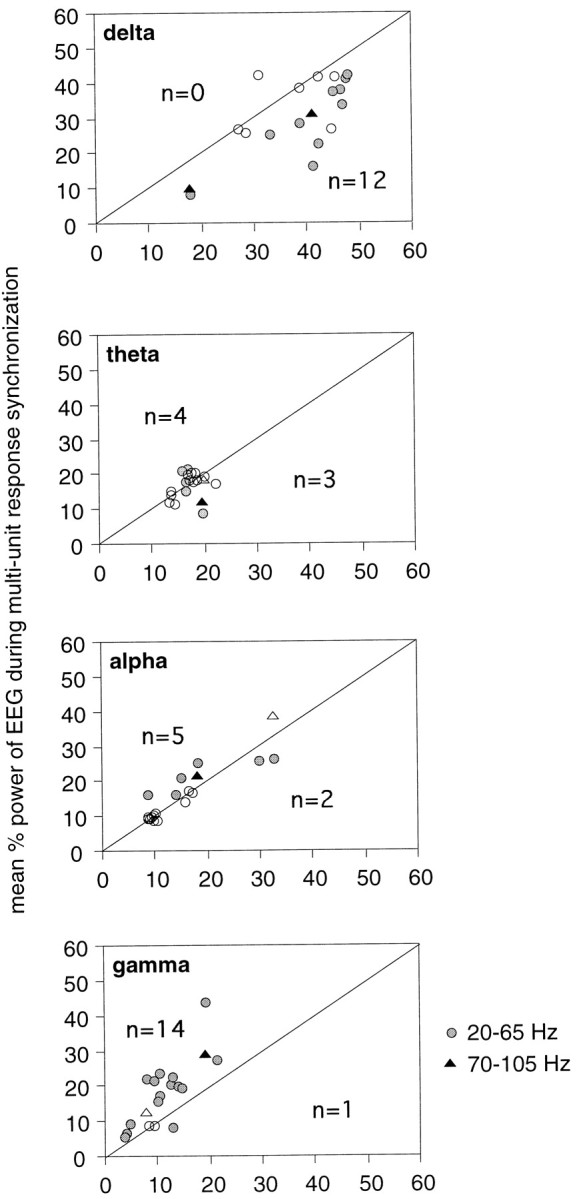
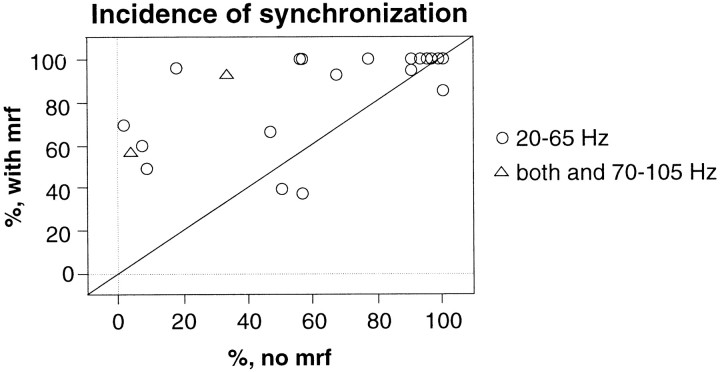
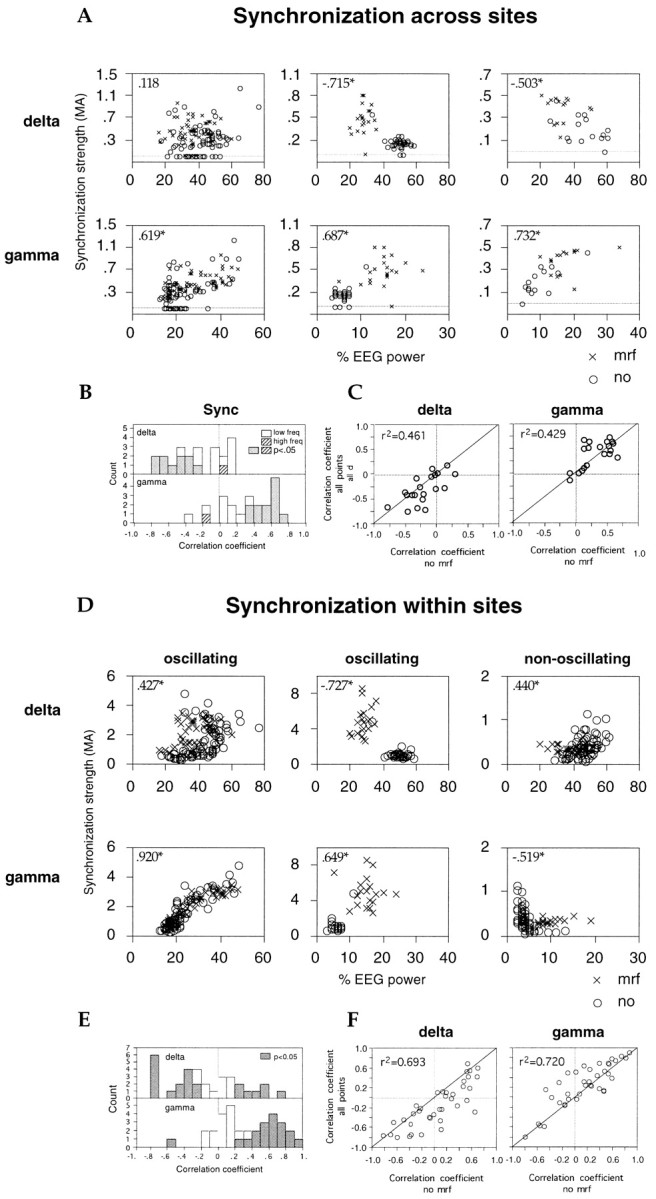
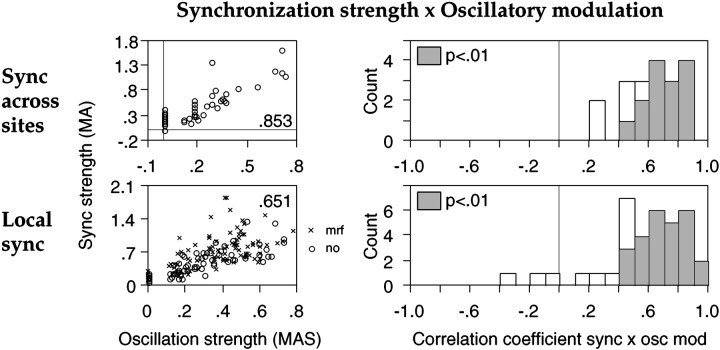
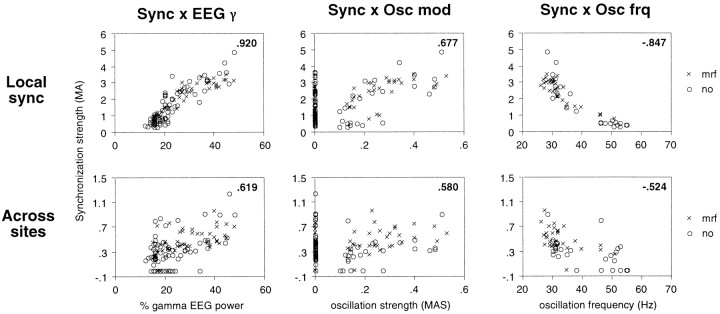
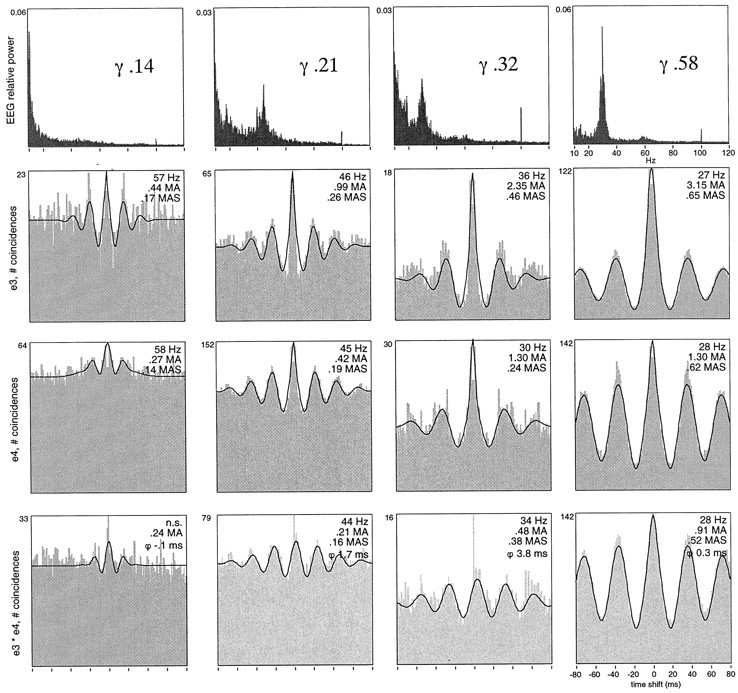
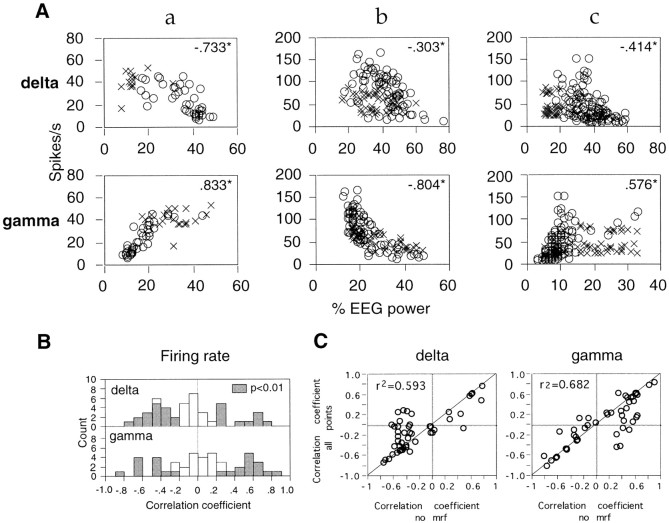
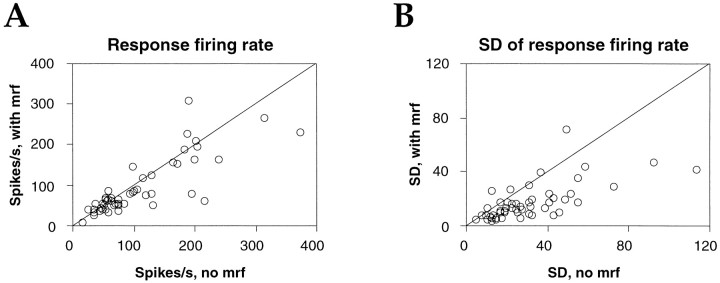
Neuronal response synchronization with millisecond precision has been proposed to serve feature binding in vision and should therefore, like visual experience, depend on central states. Here we test this hypothesis by examining the occurrence and strength of response synchronization in areas 17 and 18 of anesthetized cats as a function of central states. These were assessed from the frequency content of the electroencephalogram, low power in the delta and high power in the gamma frequency ranges (here 20-70 Hz) being considered as a signature of activated states. We evaluated both spontaneous state changes and transitions induced by electrical stimulation of the mesencephalic reticular formation. During states of low central activation, visual responses were robust but lacked signs of precise synchronization. At intermediate levels of activation, responses became synchronized and exhibited an oscillatory patterning in the range of 70-105 Hz. At higher levels of activation, a different pattern of response synchronization and oscillatory modulation appeared, oscillation frequency now being in the range of 20-65 Hz. The strength of response synchronization and oscillatory modulation in the 20-65 Hz range increased with further activation and was associated with a decrease in oscillation frequency. We propose that the oscillatory patterning in the 70-105 Hz range is attributable to oscillatory retinothalamic input and that a minimal level of activation is necessary for cortical neurons to follow this oscillatory pattern. In contrast, the synchronization of responses at oscillation frequencies in the 20-65 Hz range appears to result from intracortical synchronizing mechanisms, which become progressively more effective as central activation increases. Surprisingly, enhanced synchronization and oscillatory modulation in the gamma frequency range were not associated with consistent increases in response amplitude, excluding a simple relation between central activation and neuronal discharge rate. The fact that intracortical synchronizing mechanisms are particularly effective during states of central activation supports the hypothesis that precise synchronization of responses plays a role in sensory processing.


Figures

Fig. 1.
Fig. 1.
Experimental design and data analysis. Spike activity at up to four sites (top right, receptive field for only one site depicted here) was recorded along with the EEG over several hours, under constant levels of anesthesia, in blocks of 10 trials of consecutive presentations of an invariant visual stimulus (top right). The structure of each trial is seen in more detail in the raster display (multi-unit activity); each trial lasted 10 sec, during which the visual stimulus appeared at 3 sec and remained on for 4.5 sec. In blocks with MRF stimulation (top, gray blocks), a 75 Hz stimulation train was delivered to the MRF 150 msec before each presentation of the visual stimulus (see MRF stimulus bars above rasters). The artifact of MRF stimulation is clearly visible in both multiunit and EEG raster displays. Inset to theleft, Digitized trace of the spikes during the visual response and the threshold used for spike discrimination. A 500 msec window of the multiunit responses and the EEG is expanded to show the oscillatory patterning of the spike activity and γ activity in the EEG during individual visual responses. Power spectra and auto-correlation functions were calculated for the EEG and spike activity, respectively, for each trial, and then averaged across the 10 trials in each block.
Fig. 2.
Fig. 2.
Center graph, Relative occurrence of oscillation frequencies (y-axis) from 15 to 110 Hz (x-axis) at each of 39 recording sites (z-axis). Bottom, Averaged distribution of oscillation frequencies across all recording sites. The relative occurrence of oscillation frequencies in the range of 15–110 Hz was first calculated in 5 Hz bins for each recording site (center graph); each bin was then summed and averaged across all 39 recording sites (bottom). The distribution is clearly bimodal, clustering around 30–35 and 85–90 Hz. Top insets, Sliding window (150 msec windows, 75 msec steps) averaged auto-correlation functions at two different times for the recording site indicated in red in the center graph, showing oscillatory activity at 35 Hz (left) and 89 Hz (right). Notice the difference in response onset and duration between the two oscillation frequencies.
Fig. 3.
Fig. 3.
Scatterplots comparing the average power in different EEG bands during epochs associated with oscillatory (ordinate) and nonoscillatory (abscissa) responses. When visual responses exhibited an oscillatory modulation, the EEG contained lower relative δ and higher relative γ activity than when responses were not oscillatory. Each pointrepresents one recording site (n = 39).Symbols, Recording sites exhibiting either γ frequency (circles) or retinal-like (triangles) oscillations. Each block of 10 trials was classified as oscillatory or not, and the concurrent averaged relative EEG power in each band was pooled and averaged accordingly. Filled symbols, Averaged EEG power significantly different between oscillatory and nonoscillatory responses; p < 0.05, Mann–WhitneyU test (indicated in each graph); open symbols, no significant difference. Notice that although γ frequency oscillations had no consistent relationship with α EEG activity, retinal-like oscillations occurred at five of nine sites with significantly stronger and at none with weaker α EEG activity than nonoscillatory responses.
Fig. 4.
Fig. 4.
Effect of MRF stimulation on oscillatory modulation of visual responses. Scatterplots comparing percentile of averaged auto-correlation functions indicative of oscillatory modulation (A) and average oscillation strength (B) at each recording site, obtained with (ordinate) and without (abscissa) MRF stimulation. Each point represents one recording site.Circles, Sites exhibiting γ frequency oscillations only; crosses, sites exhibiting retinal-like oscillations only; triangles, sites exhibiting both types of oscillations.
Fig. 5.
Fig. 5.
Synchronous oscillatory modulation of visual responses appears and disappears simultaneously in areas 17 and 18 concurrently with changes in the level of cortical activation occurring spontaneously or in response to MRF stimulation. A, Comparison of the time course of changes in EEG power (top box) with response variables (bottom boxes) at three recording sites in left area 18 (LA18), right area 18 (RA18), and right area 17 (RA17): firing rates, oscillation strength, oscillation frequency, and synchronization between RA18 and RA17. As the EEG becomes dominated by activity in the γ frequency range, firing rates increase at recording site LA18 and decrease at recording sites RA18 and RA17; responses at these two sites then begin to exhibit oscillatory modulation in the γ frequency range, and their synchronization becomes stronger. Shaded bars, Periods when MRF stimulation precedes each presentation of the visual stimulus.B, Receptive fields of the recording sites and visual stimulus. C, From top tobottom, averaged power spectra and auto- and cross-correlation functions for sites RA18 and RA17 measured at the times indicated by the arrows in A(duration of analysis window, 4 sec).
Fig. 6.
Fig. 6.
Relationship between strength of oscillatory modulation and EEG activation. A, Three recording sites are shown: two exhibiting γ frequency oscillations (the site depicted on the left corresponds to RA17 in Fig.5) and one exhibiting retinal-like oscillations. Eachpoint represents the strength of oscillatory modulation of visual responses (MAS, ordinate) and concurrent relative power of the EEG in the δ and γ frequency bands (abscissa) averaged over 10 consecutive trials.Insets, Spearman correlation coefficients; *p < 0.01. Circles, Without MRF stimulation; crosses, with MRF stimulation.B, Distribution of Spearman correlation coefficients obtained for each recording site from all data points (with and without MRF stimulation). Filled bars, p < 0.01. C, Correlation between Spearman coefficients calculated from all data points combined (with and without MRF stimulation, ordinate) and Spearman coefficients obtained exclusively from trials without MRF stimulation (abscissa). Five recording sites exhibited oscillatory modulation only during MRF stimulation and are therefore not included.Insets, Linear correlation coefficients;p < 0.01.
Fig. 7.
Fig. 7.
Relationship between oscillation strength and frequency for γ frequency oscillations. A, Scatterplot for one recording site comparing the strength of oscillatory modulation (MAS, ordinate) of visual responses with oscillation frequency (hertz, abscissa). Each pointrepresents averages over 10 consecutive trials.Inset, Spearman correlation coefficient;p < 0.01. Circles, Without MRF stimulation; crosses, with MRF stimulation.B, Distribution of Spearman correlation coefficients between oscillation strength and frequency across all sites exhibiting γ frequency oscillations. Shaded bars, correlation significant at p < 0.01.
Fig. 8.
Fig. 8.
Effect of MRF stimulation on visual response oscillation frequency in the γ frequency range. Scatterplots comparing averaged oscillation frequency (A) and its SD (B) at different recording sites, when measured with (ordinate) and without (abscissa) MRF stimulation. Each pointrepresents one recording site.
Fig. 9.
Fig. 9.
Relationship between oscillation frequency and relative EEG γ power. A, Scatterplots for visual responses obtained at three different recording sites (1 perbox). The oscillation frequency of visual responses (hertz, ordinate) is plotted against the concurrent relative γ power of the EEG (percent, abscissa). Eachpoint represents the averaged values from 10 consecutive trials. Inset, Spearman correlation coefficients;p < 0.01; ns, nonsignificant.Circles, Without MRF stimulation;crosses, with MRF stimulation. B, Distribution of Spearman correlation coefficients between oscillation frequency and EEG γ power across all sites. Shaded bars, Correlation significant at p < 0.01.
Fig. 10.
Fig. 10.
Transition from nonoscillatory to retinal-like and then to γ frequency oscillatory responses with increasing EEG activation. Top row, Averaged EEG power spectra at consecutive time points without MRF stimulation. Center rows, Averaged sliding window auto-correlograms for responses from sites recorded simultaneously from area 17 in the two hemispheres [right area 17 (RA17), left area 17 (LA17)]. Bottom row, Averaged sliding window cross-correlograms for the two recording sites. Sliding window size, 150 msec; step size, 75 msec; bin width, 2 msec. All sliding window correlation functions are normalized to the total number of spikes in the period. The time course of visual stimulation is indicated at the bottom. Oscillatory modulation was in general absent when the EEG was dominated by δ activity (left column). When the γ EEG content increased, the initial phase of the light responses exhibited retinal-like oscillations at ∼95 Hz that appeared simultaneously at the recording sites in both hemispheres (compare first three columns). As γ EEG power increased further, retinal-like oscillatory modulation decreased again and gave way to a sustained oscillatory modulation in the γ frequency range (30–40 Hz, fourth column). Retinal-like oscillations at this time had disappeared from the responses at site RA17. At site LA17 there is a smooth transition between retinal-like and γ frequency oscillations that is readily seen in single responses. As EEG activation decreased again (right column), γ frequency oscillations disappeared, whereas the transient retinal-like oscillations are again well expressed in the visual responses at both sites.
Fig. 11.
Fig. 11.
Scatterplots comparing the power in different EEG bands (1 band per box) in epochs associated with synchronized (ordinate) and nonsynchronized (abscissa) responses. When visual responses exhibited synchronization, the EEG contained lower relative δ and higher relative γ activity than when the responses were not synchronized. Each point represents one recording site (n = 20). Symbols, Pairs of sites exhibiting γ frequency (circles) or retinal-like (triangles) oscillations. Responses averaged over each block of 10 trials were classified as synchronized or not, and the concurrent averaged relative EEG power in each band was pooled and averaged accordingly. Filled symbols, Averaged EEG power significantly different between synchronized and nonsynchronized responses; p < 0.05, Mann–WhitneyU test (indicated in each graph); open symbols, no significant difference.
Fig. 12.
Fig. 12.
Effect of MRF stimulation on incidence of response synchronization. Scatterplot comparing percentile of cross-correlation functions indicative of synchronization at each pair of recording sites for responses obtained with (ordinate) and without (abscissa) MRF stimulation. Each point represents one recording site.Circles, Synchronization across sites exhibiting only γ frequency oscillations; triangles, synchronization across sites exhibiting either γ frequency or retinal-like oscillations.
Fig. 13.
Fig. 13.
Relationship between EEG activation and strength of synchronization across (A) or within (B) recording sites. A, Data from three different recording site pairs recorded in different sessions (columns). Each point in the scatterplots represents the strength of synchronization in visual responses (MA,ordinate) and concurrent relative power of the EEG in the various frequency bands (abscissa) averaged over 10 consecutive trials. Insets, Spearman correlation coefficients; *p < 0.01. B, Distribution of Spearman correlation coefficients obtained for each recording pair from all data points (with and without MRF stimulation).Filled bars, p < 0.05.C, Correlation between Spearman coefficients calculated from all data points combined (with and without MRF stimulation,ordinate) and Spearman coefficients obtained exclusively from trials without MRF stimulation (abscissa). One recording pair exhibited synchronization only during MRF stimulation and is therefore not included. Insets, Linear correlation coefficients; p < 0.01 and 0.02, respectively. D–F, Local synchronization of visual responses. Conventions as in A–C. Two of the three sites in A exhibited oscillatory modulation (left and center columns), one did not (right column). F, insets, Linear correlation coefficients; p < 0.0001.
Fig. 14.
Fig. 14.
Relationship between synchronization and oscillation strength of visual responses. Left, Examples of scatterplots of synchronization strength (MA,ordinates) and oscillation strength (MAS,abscissa), where each point represents the average over 10 consecutive trials. Top, Synchronization across two recording sites; bottom, local synchronization at a different site. Insets, Spearman correlation coefficient; p < 0.01.Circles, Without MRF stimulation;crosses, with MRF stimulation. Right, Distribution of Spearman correlation coefficients between strength of oscillation and of synchronization across sites (top) or locally (bottom). Shaded bars, Correlation significant at p < 0.01.
Fig. 15.
Fig. 15.
Relationship between local synchronization (top row) or synchronization across sites (bottom row) and γ power of the EEG (Sync ×EEG γ, left column), oscillatory modulation (Sync × Osc mod,center column), and oscillation frequency (Sync × Osc frq, right column). Two sites were recorded from A17 of the same hemisphere; the strength of local synchronization is depicted for only one of the two sites. Ordinates, Strength of synchronization (MA). Abscissas, fromleft to right, Relative γ power of the EEG, strength of oscillatory modulation (MAS), and oscillation frequency (hertz) at the site depicted in the top row. Examples of correlograms from the two sites are displayed in Figure 16.Circles, No MRF; crosses, during MRF stimulation. Insets, Spearman correlation coefficients;p < 0.01.
Fig. 16.
Fig. 16.
Covariation of EEG γ activity with oscillation frequency, oscillatory modulation, local synchronization, and intrahemispheric synchronization of visual responses recorded from two sites in A17 (e3, e4, same as in Fig.15). Top row, Averaged EEG power spectra at four nonconsecutive time points, the second one having been obtained during MRF stimulation. Numbers refer to relative γ power in the respective epochs. Second row, Averaged auto-correlation functions of visual responses recorded during corresponding epochs from site e3; third row, averaged auto-correlation functions of responses from e4; bottom row, averaged cross-correlation functions of visual responses across sites e3 and e4. For each correlogram, oscillation frequency (hertz), oscillation strength (MAS), and synchronization strength (MA) and phase (ϕ, milliseconds) are indicated. With increasing relative γ content in the EEG (left to right columns), the oscillation frequency of the visual responses decreases from ∼60 to <30 Hz at both sites. At the same time, the strength of oscillatory modulation of local synchronization and of synchronization across the sites increases.
Fig. 17.
Fig. 17.
Relationship between firing rates and EEG activation. A, Three different recording sites are illustrated (a–c). Each point in the scatterplots represents the response firing rate at a recording site and the concurrent relative power of the EEG in the δ (top row) and γ (bottom row) frequency bands, averaged over 10 consecutive trials. Circles, No MRF;crosses, during MRF stimulation. Insets, Spearman correlation coefficient; *p < 0.01.B, Distribution of Spearman correlation coefficients obtained for each recording site from all data points (with and without MRF stimulation). Filled bars, p < 0.01. C, Correlation between Spearman coefficients calculated from all data points combined (with and without MRF stimulation, ordinate) and Spearman coefficients obtained exclusively from trials without MRF stimulation (abscissa). Insets, Linear correlation coefficients; p < 0.0001.
Fig. 18.
Fig. 18.
Effect of MRF stimulation on visual response firing rates. Scatterplots comparing averaged firing rate (A) and its SD (B) at each recording site, obtained with (ordinate) and without (abscissa) MRF stimulation. Each pointrepresents one recording site.

References

    1. Abeles M, Prut Y, Bergman H, Vaadia E. Synchronization in neuronal transmission and its importance for information processing. In: Buzsáki G, editor. Temporal coding in the brain. Springer; Heidelberg: 1994. pp. 39–50. - PubMed
    1. Castelo-Branco M, Neuenschwander S, Singer W. Synchronization of visual responses between the cortex, lateral geniculate nucleus, and retina in the anesthetized cat. J Neurosci. 1998;18:6395–6410. - PMC - PubMed
    1. Engel AK, König P, Gray CM, Singer W. Stimulus-dependent neuronal oscillations in cat visual cortex: intercolumnar interaction as determined by cross-correlation analysis. Eur J Neurosci. 1990;2:588–606. - PubMed
    1. Engel AK, König P, Singer W. Direct physiological evidence for scene segmentation by temporal coding. Proc Natl Acad Sci USA. 1991;88:9136–9140. - PMC - PubMed
    1. Freiwald WA, Kreiter AK, Singer W. Oscillatory and synchronous activity states in the macaque inferotemporal cortex. Soc Neurosci Abstr. 1998;24:355.

Publication types

LinkOut - more resources