. 1999 May 15;19(10):4090-101.
doi: 10.1523/JNEUROSCI.19-10-04090.1999.

Reactivation of hippocampal cell assemblies: effects of behavioral state, experience, and EEG dynamics

Affiliations

Reactivation of hippocampal cell assemblies: effects of behavioral state, experience, and EEG dynamics

H S Kudrimoti et al. J Neurosci. .

Abstract

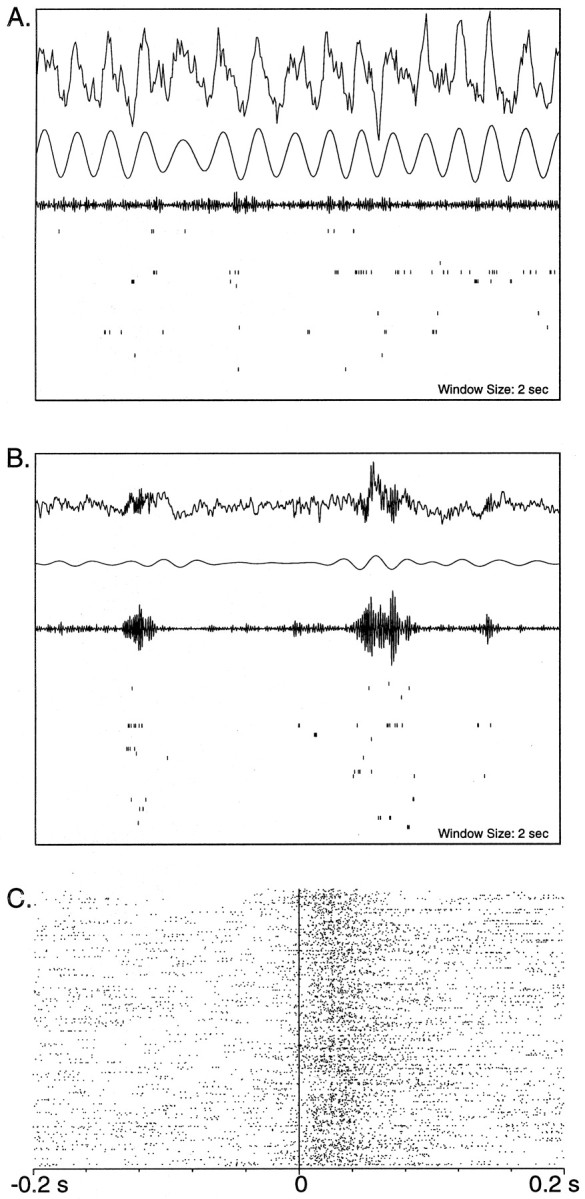
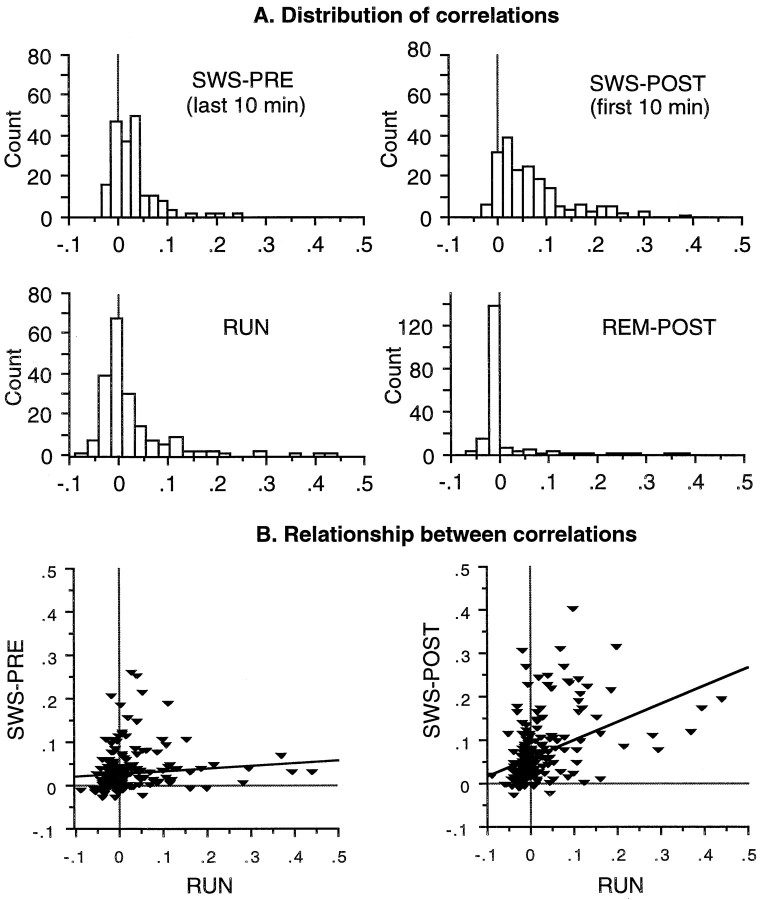
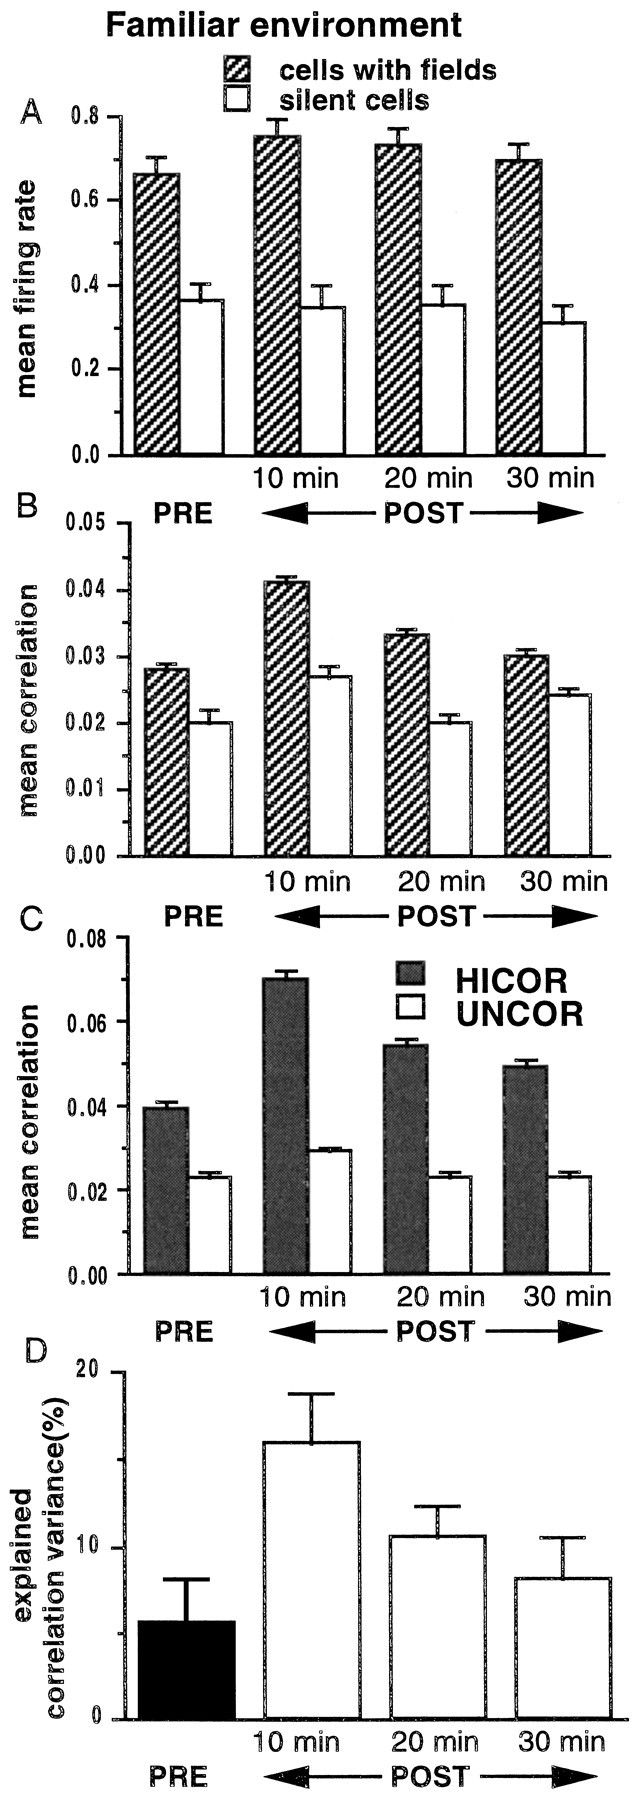
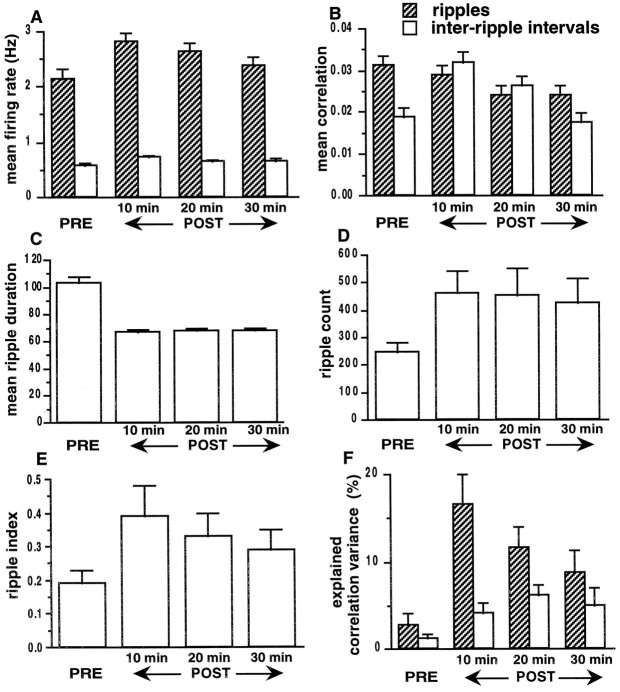
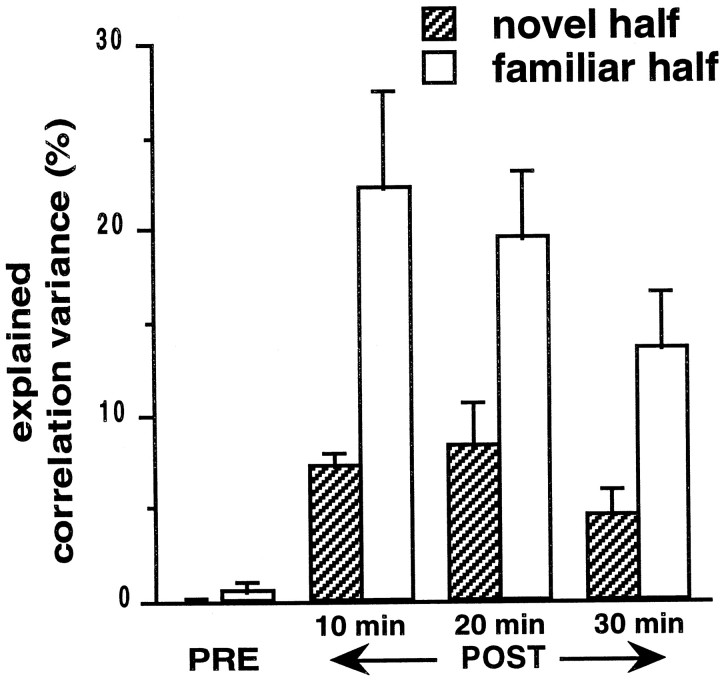
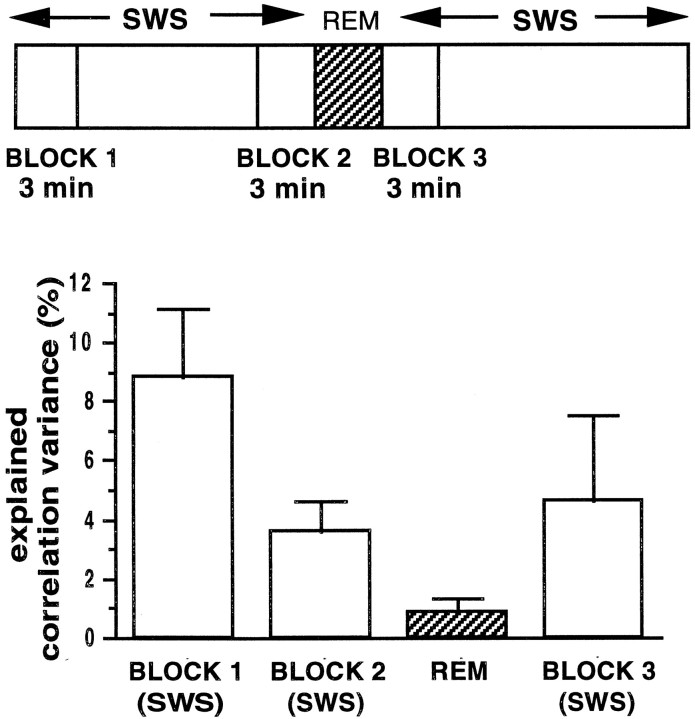
During slow wave sleep (SWS), traces of neuronal activity patterns from preceding behavior can be observed in rat hippocampus and neocortex. The spontaneous reactivation of these patterns is manifested as the reinstatement of the distribution of pairwise firing-rate correlations within a population of simultaneously recorded neurons. The effects of behavioral state [quiet wakefulness, SWS, and rapid eye movement (REM)], interactions between two successive spatial experiences, and global modulation during 200 Hz electroencephalographic (EEG) "ripples" on pattern reinstatement were studied in CA1 pyramidal cell population recordings. Pairwise firing-rate correlations during often repeated experiences accounted for a significant proportion of the variance in these interactions in subsequent SWS or quiet wakefulness and, to a lesser degree, during SWS before the experience on a given day. The latter effect was absent for novel experiences, suggesting that a persistent memory trace develops with experience. Pattern reinstatement was strongest during sharp wave-ripple oscillations, suggesting that these events may reflect system convergence onto attractor states corresponding to previous experiences. When two different experiences occurred in succession, the statistically independent effects of both were evident in subsequent SWS. Thus, the patterns of neural activity reemerge spontaneously, and in an interleaved manner, and do not necessarily reflect persistence of an active memory (i.e., reverberation). Firing-rate correlations during REM sleep were not related to the preceding familiar experience, possibly as a consequence of trace decay during the intervening SWS. REM episodes also did not detectably influence the correlation structure in subsequent SWS, suggesting a lack of strengthening of memory traces during REM sleep, at least in the case of familiar experiences.


Figures

Fig. 1.
Fig. 1.
A, B, EEG traces and concurrent hippocampal single-unit activity during 2 sec periods of REM and SWS in POST. In both A and B, thetop trace is the raw EEG waveform acquired by sampling at 200 Hz (A) and 1 kHz (B). The second and third waveforms are the EEG data bandpass filtered between 6 and 10 Hz and between 100 and 300 Hz, respectively. In A, the 100–300 Hz bandwidth was achieved by filtering the 1 kHz–sampled raw data. At the bottom in A andB are rasters of 36 pyramidal neurons of the CA1 region that fired on the track (not all were active in the time windows shown). Each vertical tick mark represents one neuronal action potential, and each row of tick marks represents the activity of one neuron over 2 sec. Theta rhythm during REM sleep is shown in A. The filtered waveform in A shows a large 7–8 Hz component compared with that in the corresponding filtered waveform in B. The third waveform shows very small amplitude 100–300 Hz components in these data. Slow wave sleep is illustrated inB. There is an absence of theta modulation in the EEG; however, characteristic large amplitude 200 Hz ripples are clearly observed in the raw data as well as in the 100–300 Hz–filtered waveform. Coincident with the ripples is a burst of activity of the CA1 pyramidal cells, which do not fire in the same manner between ripples. C, A raster plot of population activity with respect to ripples. In the figure, 475 ripples occurred in the 10 min epoch of slow wave sleep represented. The start of each ripple oscillation is aligned to the vertical line at 0. Each row of tick marksrepresents the firing of the population (i.e., it is a combination of spike trains of all of the 36 cells) in a 200 msec window centered around the start of a ripple. It is clearly seen that there is an increase in population discharge during the ripple oscillations, as compared with that in the periods just before the ripples.
Fig. 2.
Fig. 2.
A, Example distributions of the pairwise correlations from one recording session (familiar track). Histograms show distributions of correlations during SWS PRE (last 10 min), SWS POST (first 10 min), track-running behavior (RUN), and REM POST. B, Data from the same recording session showing the relationship between pairwise correlations during RUN and SWS PRE (left) and the relationship between correlations during RUN and SWS POST (right). Each data point in the scatterplots corresponds to one cell pair, both members of which had place fields on the track. For illustrative purposes, the relationship between track and sleep correlations has been shown using a simple linear regression fit. In the actual analysis of POST versus RUN, a multiple correlation model that controlled for the effects of PRE was used.
Fig. 3.
Fig. 3.
A, Histograms of the mean firing rates of pyramidal neurons during pre-behavior SWS (PRE) and three 10 min intervals in post-behavior SWS (POST), computed by averaging across 22 track-running sessions from seven rats, are shown. The firing rates of cells with place fields on the track (n = 423) increased marginally (p > 0.05, ANOVA) and returned rapidly toward their PRE levels with a time constant of 20 min. For all periods, the firing rates of cells with fields on the track were significantly higher than were the firing rates of cells inactive during track running (n = 237;p < 0.05, ANOVA). B, Mean correlations of cell pairs (using 100 msec bins) during the same time periods described in A are shown. The mean correlation of cells active on the track increased from PRE to POST (p < 0.05), but the increase rapidly declined over the 30 min period (τ = 12 min). The mean correlations of cells inactive on the track did not change significantly (p > 0.05, ANOVA). C, In the cell group with fields on the track, correlation values were sorted into HICOR (correlation ≥ 0.01) and UNCOR (correlation < 0.01) sets. The mean correlation of the HICOR set was significantly higher compared with the mean correlation of the UNCOR set (p < 0.05, ANOVA). This difference, present in 6 of 22 sessions in PRE, was enhanced in all 22 sessions during POST (significant interaction on a repeated-measure ANOVA) as the mean correlation of the HICOR set (mean correlation of 0.10 ± 0.003 on track) increased from a PRE value of 0.04 ± 0.002 to a POST value of 0.07 ± 0.002 (p < 0.05, ANOVA). This increase decayed rapidly (τ = 18 min). The mean correlation of the UNCOR set (mean correlation of −0.02 ± 0.000 on track) increased from a PRE value of 0.02 ± 0.001 to 0.03 ± 0.000 in POST (p > 0.05, ANOVA). It is theoretically possible that the differences in the mean correlations between the two groups in the histogram could be attributable to differences in the firing rates of the neurons in the two groups; however, the majority of cells were members of pairs in both groups, and there were no significant differences in the mean firing rates between the HICOR and UNCOR cells during POST (19 of 22 sessions;p > 0.05). D, Explained correlation variance (EV) during the same time periods described inA are shown. For PRE, EV was computed using the square of the simple correlation coefficientrRUN–PRE (solid bar onleft). For POST, EV was computed using the square of the partial correlation coefficientrRUN–POST‖PRE (3 bars onright). The EV for all periods of SWS was significantly >0 (p < 0.001, ANOVA) and increased significantly after behavior (p < 0.05, ANOVA). The decay time constant (baseline = 0) was 30 min, suggesting that the similarity of the correlation matrices for the RUN and POST periods outlasts changes in the average magnitude per se. Note that the baseline for the POST EV is 0, not the PRE value, which is removed by the partial correlation procedure (see Materials and Methods).
Fig. 4.
Fig. 4.
Ripple analysis for a subset of data from experiment 1 (12 recording sessions; familiar environment).A, Histograms show the mean firing rates of the population with place fields (n = 258), during ripples and during inter-ripple intervals. For all periods, the firing rates during ripples were significantly higher than were the firing rates during inter-ripple intervals of comparable duration (p < 0.05). The firing rates during ripples increased from PRE to POST (p < 0.05) and decayed over a 30 min period with a time constant of ∼13 min. The firing rates during inter-ripple intervals did not change (p > 0.05). B, During POST, mean correlations during ripples and inter-ripple intervals were not different (p > 0.05). The mean correlation of the population during ripples did not change from PRE to POST. The mean correlation during inter-ripple intervals increased from PRE to POST but decayed rapidly (τ = 8 min) to PRE levels. C, The average duration of ripples decreased from PRE to POST (p < 0.05) but remained constant during the 30 min of SWS in POST (p > 0.05).D, The number of ripples increased from PRE to POST (p < 0.05) but did not decrease significantly over the 30 min interval (p > 0.05). E, Histograms show a ripple index that was computed as: (percent time in the ripple state × the mean firing rate of the population during ripples)/(percent time in the inter-ripple state × the mean firing rate of the population during inter-ripple intervals). The index increased from PRE to POST (p < 0.05), and there was a decreasing trend in POST (τ = 28 min). F, For PRE (ripple and inter-ripple periods), EV was computed using the square of the simple correlation coefficient rRUN–PRE(bars on left). For POST (ripple and inter-ripple periods), EV was computed using the square of the partial correlation coefficient rRUN–POST‖PRE (3 sets of bars on right). EV during ripples and inter-ripple intervals in POST was significantly above chance (p < 0.05) and increased significantly after behavior (p < 0.05, ANOVA). During the first 10 min of SWS, the EV was greater during ripples (p < 0.05). The decay time constant for the explained correlation variance during ripples was 30 min. (Note again that the baseline for the POST EV is 0, not the PRE value, which is subtracted by the partial correlation procedure).
Fig. 5.
Fig. 5.
In experiment 2, the animals traversed the familiar half of the digital 8–shaped track first and then ran on the second, novel half of the track before running on the familiar half again. During POST, the independent contributions of both regions to the explained variance (i.e., after controlling for any correlation between regions) were significantly above chance. Also, the EV for the familiar half was significantly above that for the novel half (p < 0.05, Mann–Whitney Utest). For both halves, the explained variance had slower time constants of decay (∼43 min), in comparison with that of the familiar-only experiments.
Fig. 6.
Fig. 6.
Top, Correlations were computed in POST during the first and last 3 min of a 10 min SWS period (blocks 1, 2) before the first REM episode and during a 3 min period after the REM episode (block 3). Bottom, The EV during REM was significantly smaller than that in the preceding SWS (blocks 1,2; p < 0.05, Mann–WhitneyU test) and was not significantly >0 (p > 0.05). The EV for block 3 was significantly lower than that in block 1(p < 0.05), as expected (e.g., Fig.3D). Between blocks 2 and3, a decreasing trend in ripple count was observed (196 ± 15 in block 2 compared with 133 ± 13 in block 3; p < 0.05). The firing rates during ripples showed a trend toward an increase (block 2, 2.06 ± 0.17 Hz; block 3, 2.23 ± 0.19 Hz; p < 0.06). During inter-ripple intervals, the firing rates showed a net decrease (block 2, 0.57 ± 0.05 Hz; block 3, 0.50 ± 0.06 Hz;p < 0.05).

Similar articles

Cited by

References

    1. Bliss TVP, Gardner-Medwin AR. Long-lasting potentiation of synaptic transmission in the dentate area of the unanaesthetised rabbit following stimulation of perforant path. J Physiol (Lond) 1973;232:357–374. - PMC - PubMed
    1. Bliss TVP, Lømo T. Long-lasting potentiation of synaptic transmission in the dentate area of the anaesthetised rabbit following stimulation of perforant path. J Physiol (Lond) 1973;232:331–356. - PMC - PubMed
    1. Bloch V, Hennevin E, Leconte P. Relationship between paradoxical sleep and memory processes. In: Brazier MAB, editor. Brain mechanisms in memory and learning: from the single neuron to man. Raven; New York: 1979. pp. 329–343.
    1. Buzsáki G. Hippocampal sharp waves: their origin and significance. Brain Res. 1986;398:242–252. - PubMed
    1. Buzsáki G. Two-stage model of memory trace formation: a role for “noisy” brain states. Neuroscience. 1989;31:551–570. - PubMed

Publication types

LinkOut - more resources