

National health expenditure growth in the 1980's: an aging population, new technologies, and increasing competition
- PMID: 10309852
- PMCID: PMC4191308
National health expenditure growth in the 1980's: an aging population, new technologies, and increasing competition
Abstract
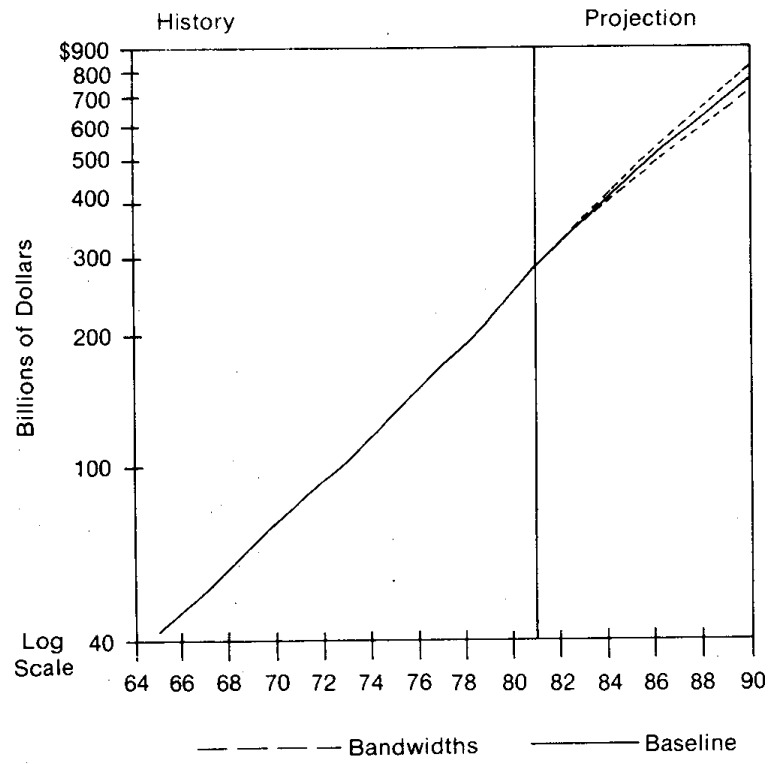
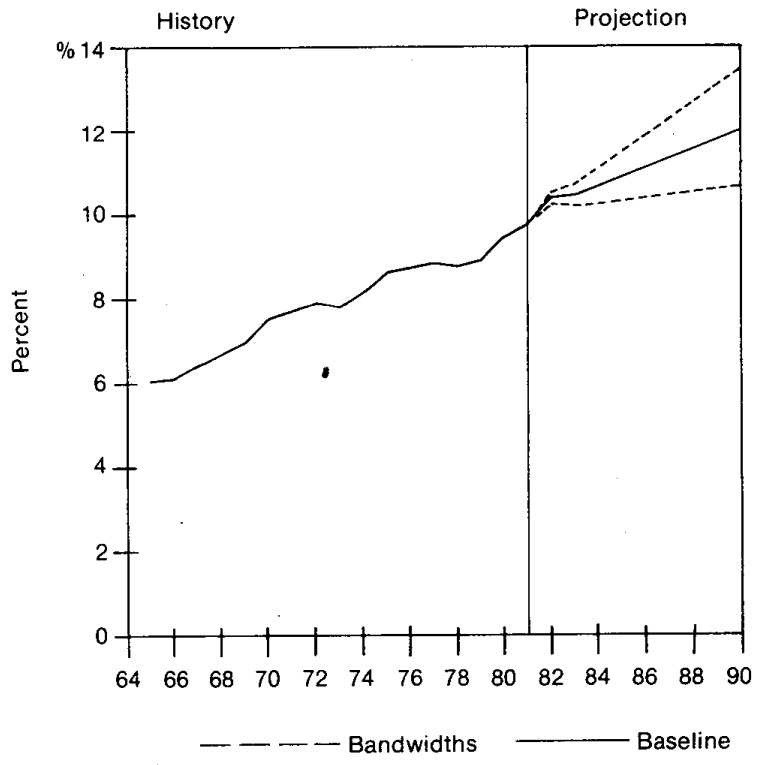
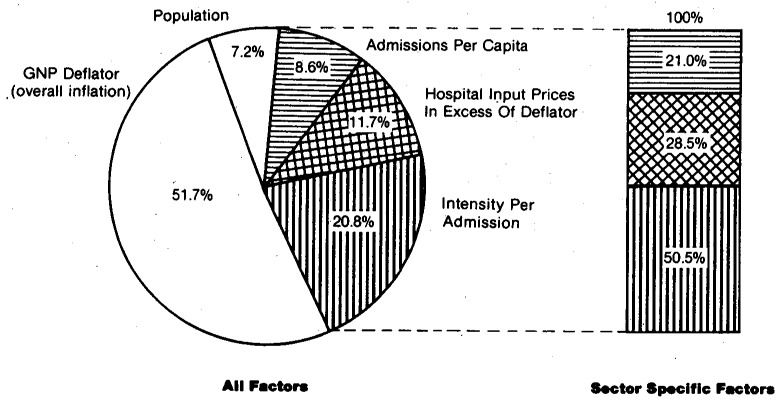
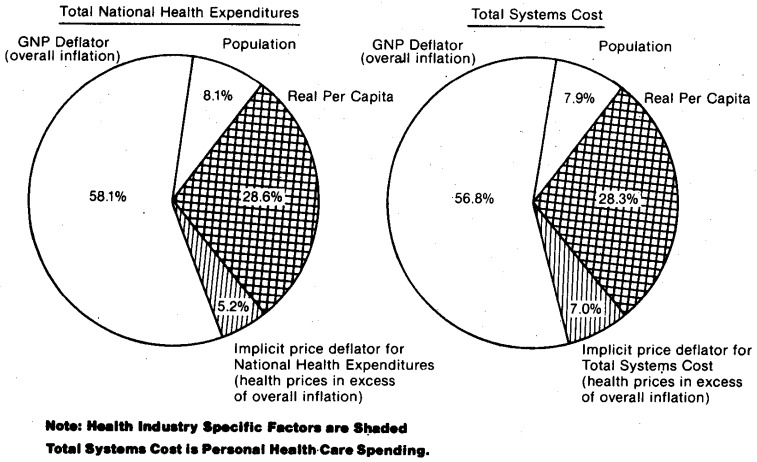
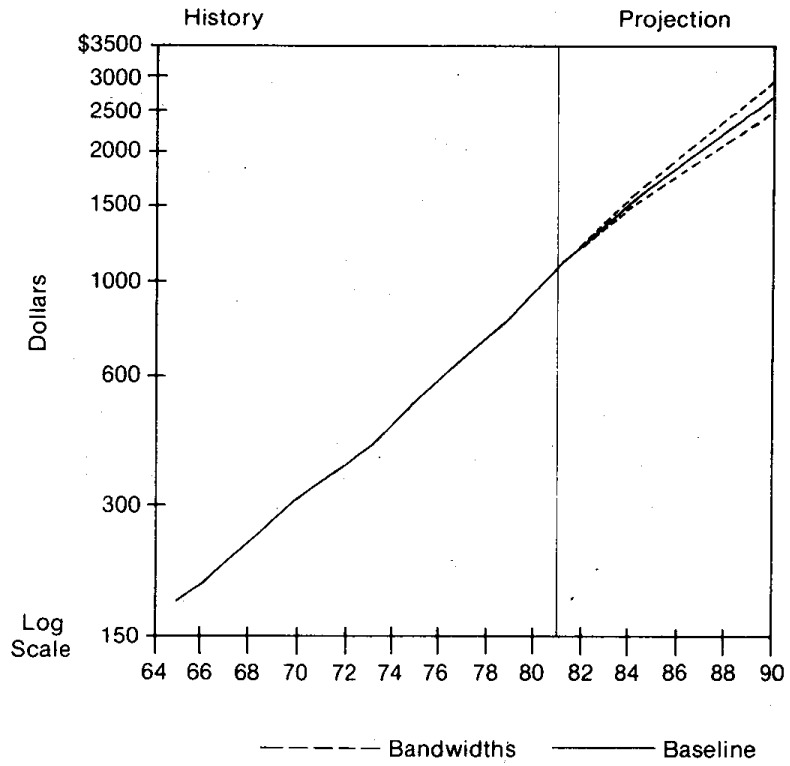
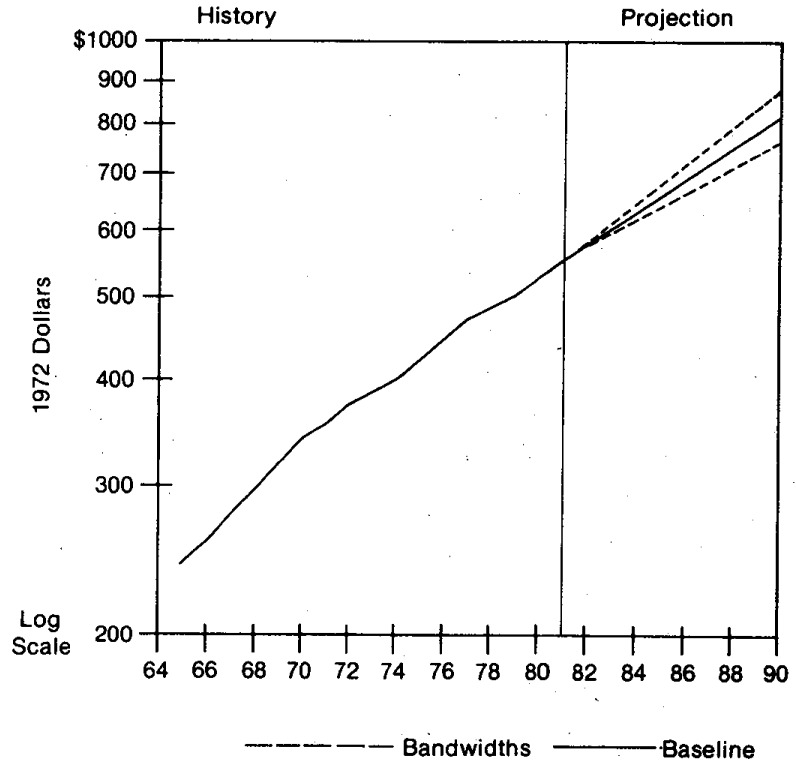
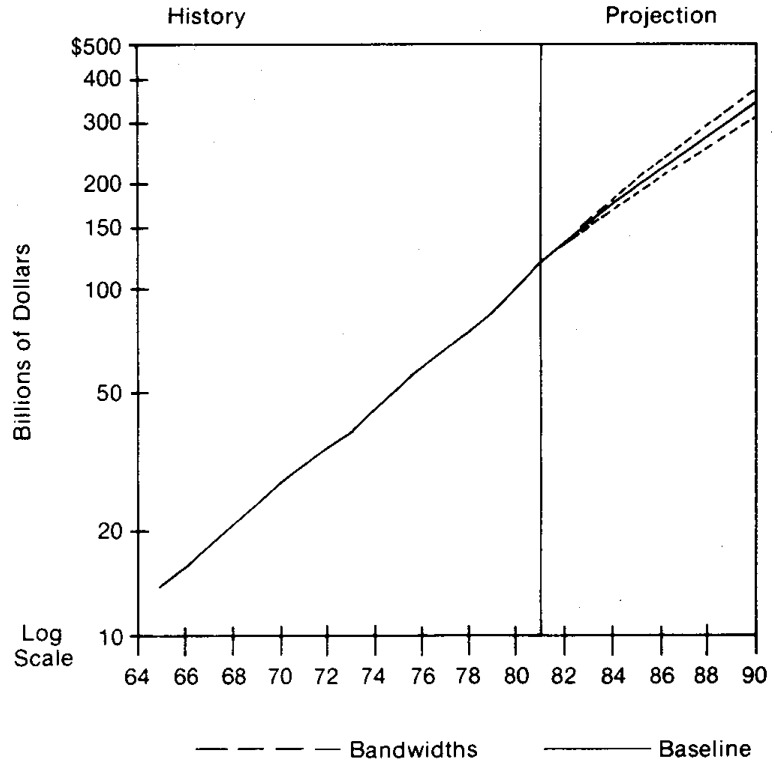
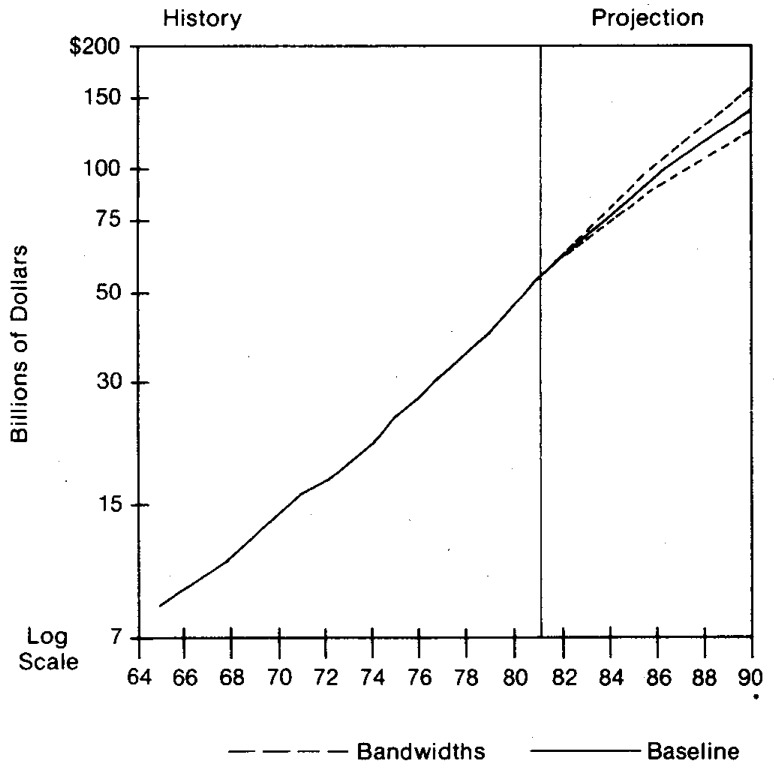
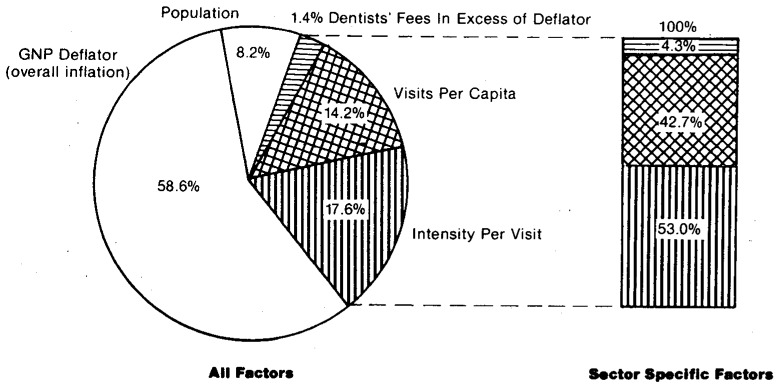
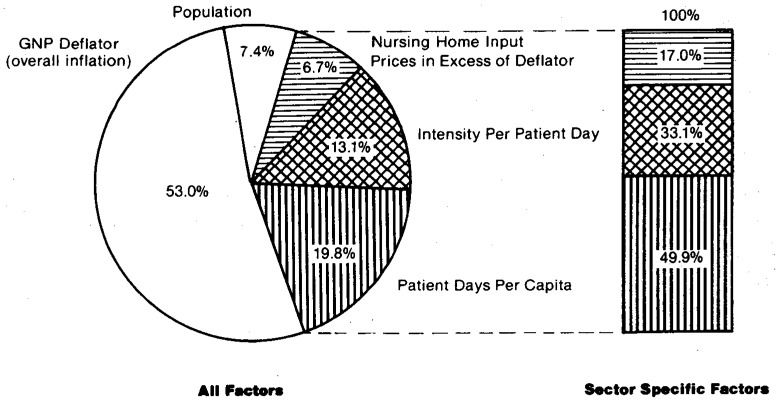
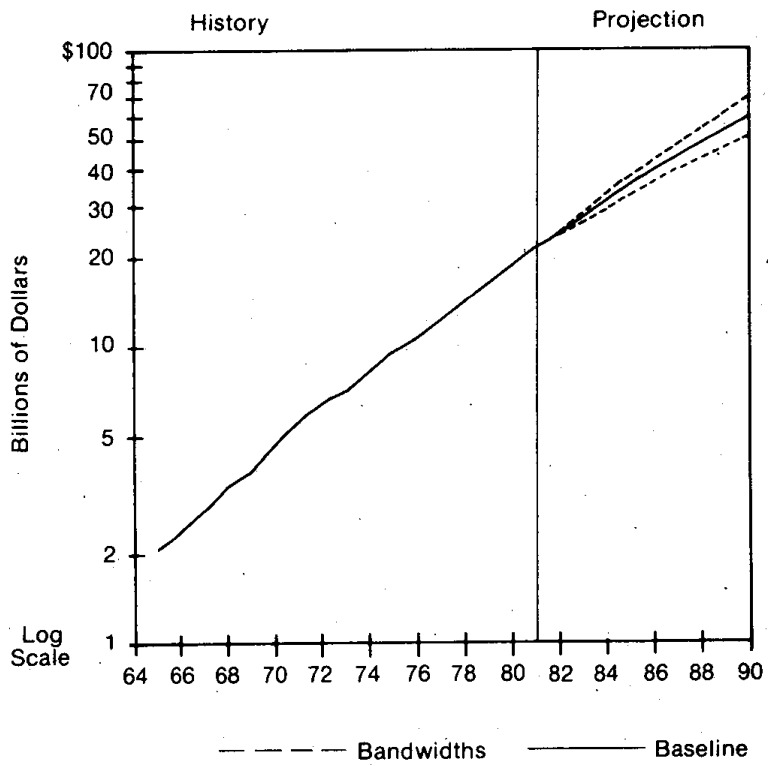
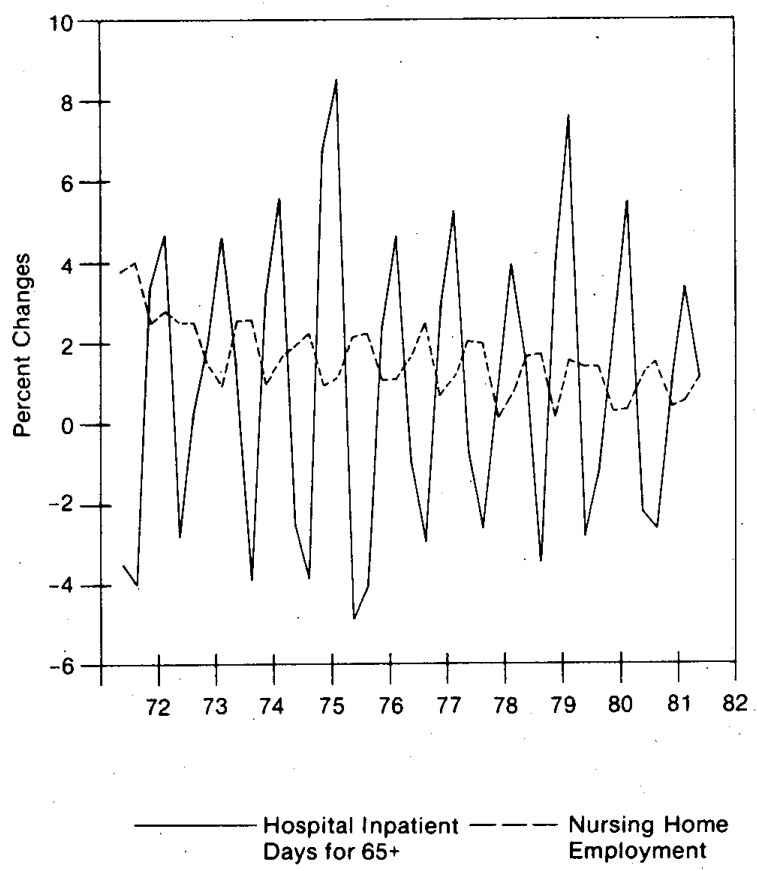
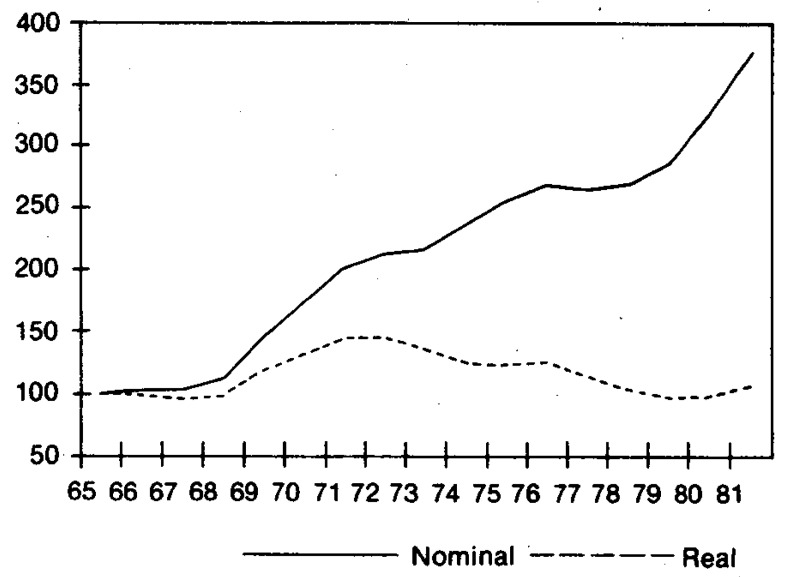
Health care spending in the United States more than tripled between 1971 and 1981, increasing from $83 billion to $287 billion. This growth in health sector spending substantially outpaced overall growth in the economy, averaging 13.2 percent per year compared to 10.5 percent for the gross national product (GNP). By 1981, one out of every ten dollars of GNP was spent on health care, compared to one out of every thirteen dollars of GNP in 1971. If current trends continue and if present health care financing arrangements remain basically unchanged, national health expenditures are projected to reach approximately $756 billion in 1990 and consume roughly 12 percent of GNP. The focal issue in health care today is cost and cost increases. The outlook for the 1980's is for continued rapid growth but at a diminished rate. The primary force behind this moderating growth is projected lower inflation. However, real growth rates are also expected to moderate slightly. The chief factors influencing the growth of health expenditures in the eighties are expected to be aging of the population, new medical technologies, increasing competition, restrained public funding, growth in real income, increased health manpower, and a deceleration in economy-wide inflation. Managers, policy makers and providers in the health sector, as in all sectors, must include in today's decisions probable future trends. Inflation, economic shocks, and unanticipated outcomes of policies over the last decade have intensified the need for periodic assessments of individual industries and their relationship to the macro economy. This article provides such an assessment for the health care industry. Baseline current-law projections of national health expenditures are made to 1990.
Figures
Similar articles
-
Health spending trends in the 1980's: adjusting to financial incentives.Health Care Financ Rev. 1985 Spring;6(3):1-26. Health Care Financ Rev. 1985. PMID: 10311158 Free PMC article.
-
Health spending in the 1980's: integration of clinical practice patterns with management.Health Care Financ Rev. 1984 Spring;5(3):1-68. Health Care Financ Rev. 1984. PMID: 10310595 Free PMC article.
-
Projections of national health expenditures, 1980, 1985, and 1990.Health Care Financ Rev. 1980 Winter;1(3):1-27. Health Care Financ Rev. 1980. PMID: 10309132 Free PMC article.
-
National health expenditures: short-term outlook and long-term projections.Health Care Financ Rev. 1981 Winter;2(3):97-138. Health Care Financ Rev. 1981. PMID: 10309366 Free PMC article. Review.
-
Hong Kong's domestic health spending--financial years 1989/90 through 2004/05.Hong Kong Med J. 2008 Apr;14 Suppl 2:2-23. Hong Kong Med J. 2008. PMID: 18587162 Review.
Cited by
-
National health expenditures, 1982.Health Care Financ Rev. 1983 Fall;5(1):1-31. Health Care Financ Rev. 1983. PMID: 10310273 Free PMC article.
-
Study of influential factors of provincial health expenditure -analysis of panel data after the 2009 healthcare reform in China.BMC Health Serv Res. 2020 Jul 1;20(1):606. doi: 10.1186/s12913-020-05474-1. BMC Health Serv Res. 2020. PMID: 32611335 Free PMC article.
-
Physician utilization and expenditures in a Medicaid population.Health Care Financ Rev. 1986 Winter;8(2):17-26. Health Care Financ Rev. 1986. PMID: 10312009 Free PMC article.
-
A model to assess the quality-cost tradeoff in nursing homes.Health Serv Res. 1986 Jun;21(2 Pt 1):145-60. Health Serv Res. 1986. PMID: 3733456 Free PMC article.
-
Government health policy and the diffusion of new medical devices.Health Serv Res. 1986 Dec;21(5):681-711. Health Serv Res. 1986. PMID: 3818311 Free PMC article.
References
-
- Alhadeff David A. Microeconomics and Human Behavior: Toward a New Synthesis of Economics and Psychology. Berkeley, California: University of California Press; 1982.
-
- Allard Mary Ann, Toff Gail. Current and Future Development of Intermediate Care Facilities for the Mentally Retarded: A Survey of State Officials. Washington, D.C.: George Washington University; Aug, 1980. Intergovernmental Health Policy Project.
-
- Altman Drew, Greene Richard, Sapolsky Harvey M. Health Planning and Regulation: The Decision-Making Process. Ann Arbor, Michigan: Health Administration Press; 1981.
-
- Altman Stuart H, Blendon Robert., editors. Proceedings of the 1977 Sun Valley Forum on National Health. 1979. Medical Technology: The Culprit Behind Health Care Costs? pp. 79–3216. DHEW Publication No. (PHS)
-
- American Hospital Association. Hospital Statistics. Chicago: 1982.
Publication types
MeSH terms
LinkOut - more resources
Full Text Sources