

Reliability and validity in hospital case-mix measurement
- PMID: 10309909
- PMCID: PMC4191289
Reliability and validity in hospital case-mix measurement
Abstract
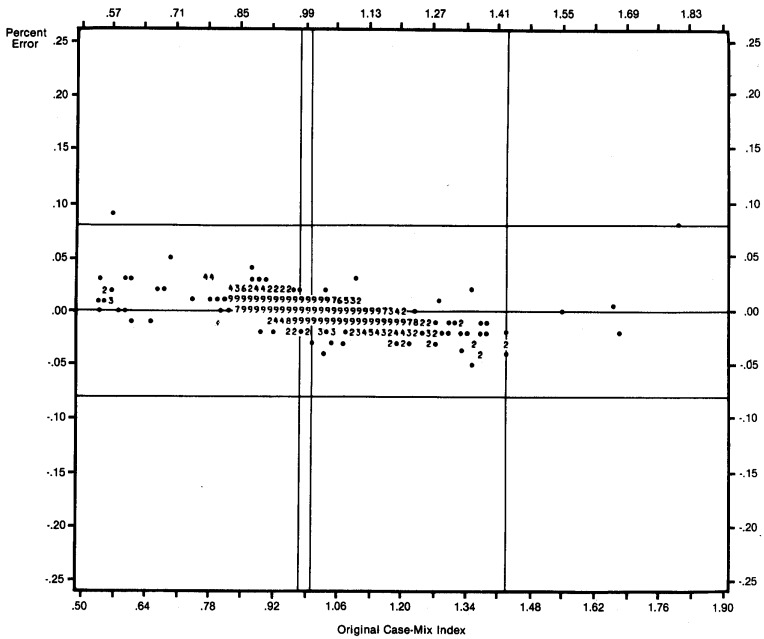
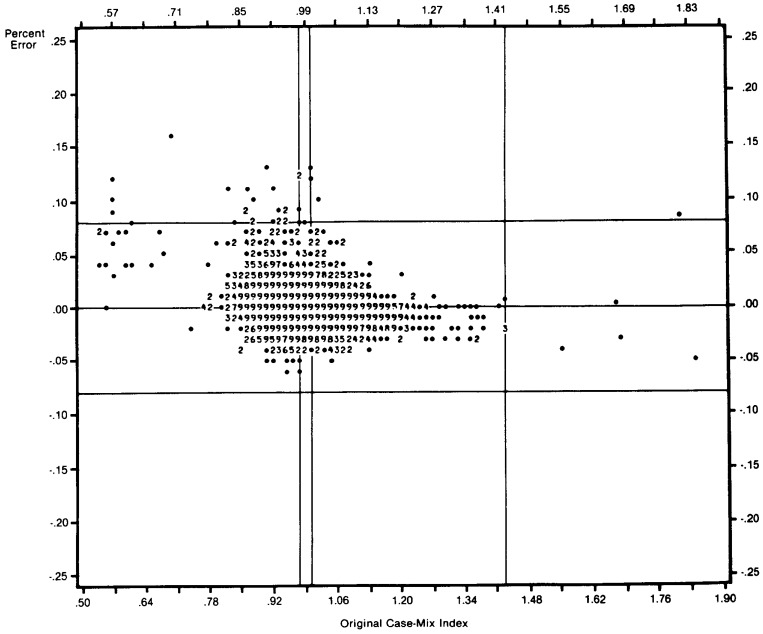
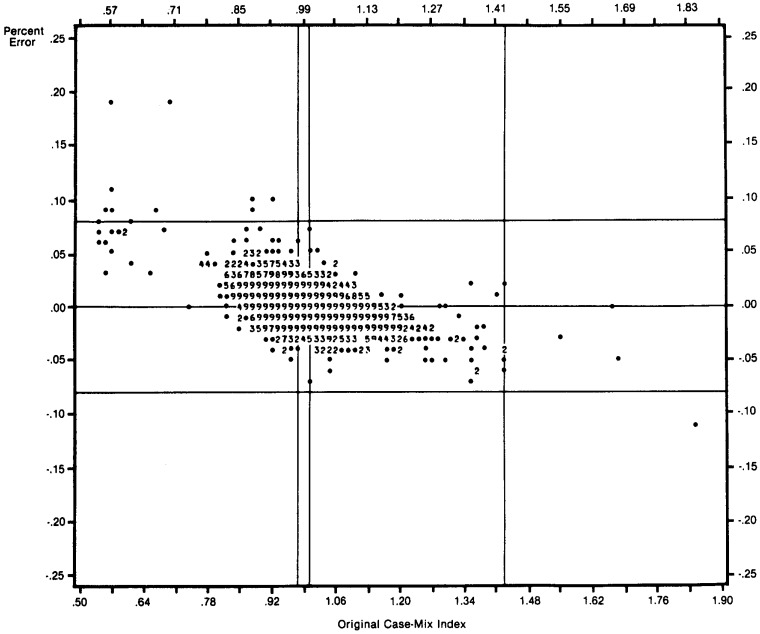
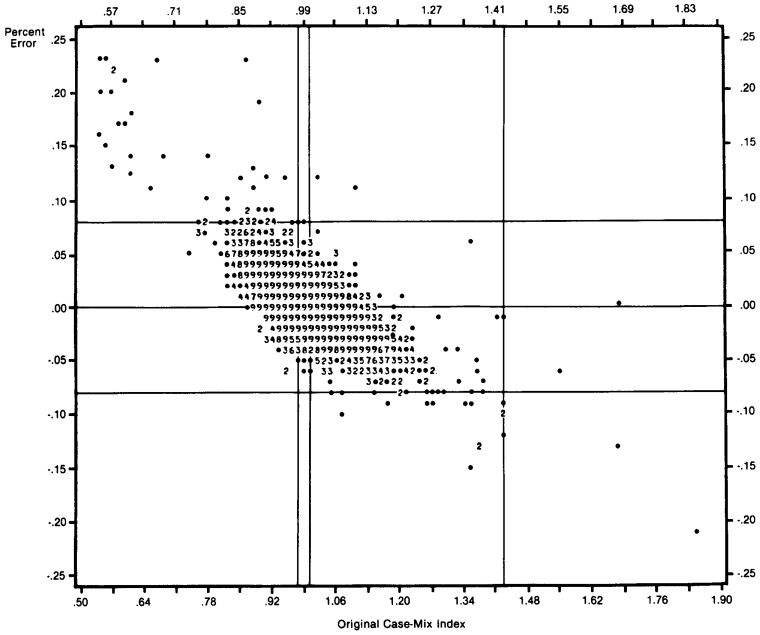
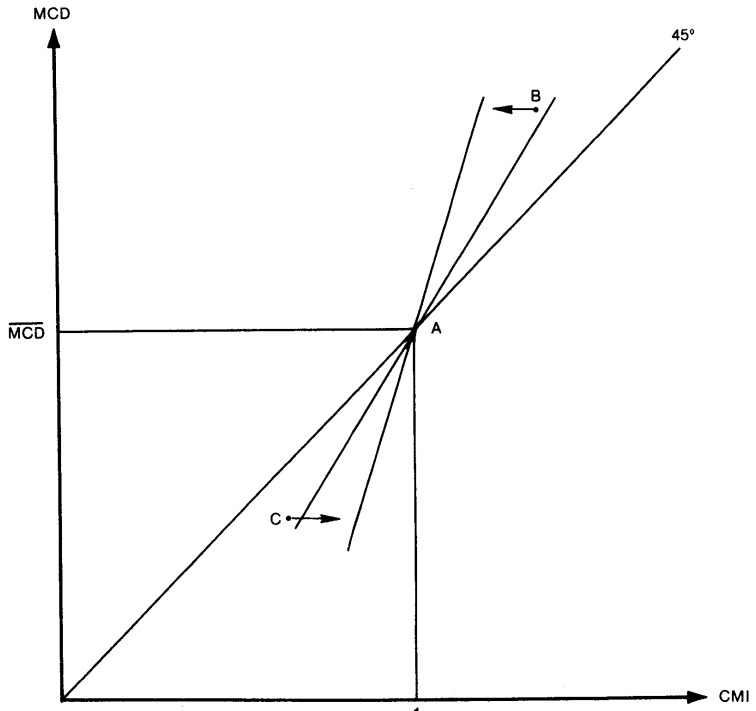
There is widespread interest in the development of a measure of hospital output. This paper describes the problem of measuring the expected cost of the mix of inpatient cases treated in a hospital (hospital case-mix) and a general approach to its solution. The solution is based on a set of homogeneous groups of patients, defined by a patient classification system, and a set of estimated relative cost weights corresponding to the patient categories. This approach is applied to develop a summary measure of the expected relative costliness of the mix of Medicare patients treated in 5,576 participating hospitals. The Medicare case-mix index is evaluated by estimating a hospital average cost function. This provides a direct test of the hypothesis that the relationship between Medicare case-mix and Medicare cost per case is proportional. The cost function analysis also provides a means of simulating the effects of classification error on our estimate of this relationship. Our results indicate that this general approach to measuring hospital case-mix provides a valid and robust measure of the expected cost of a hospital's case-mix.
Figures
References
-
- Ament R. The Use of Case Mix Figures in Analyzing Average Charges for Inpatients. PAS Reporter. 1976 Mar;
-
- Ament R, Loop R. A Simple Measure of the Impact of Patient Mix: the Appendicitis Equivalent Index. PAS Reporter. 1974 Oct;
-
- Christensen LR, Jorgensen DW, Lau LJ. Transcendental Logarithmic Production Frontiers. Review of Economics and Statistics. 1973 Feb;55(No. 28)
-
- Feldstein M. Economic Analysis for Health Efficiency. Amsterdam: North Holland Publishing Co.; 1967.
MeSH terms
LinkOut - more resources
Full Text Sources
Medical