

Health spending in the 1980's: integration of clinical practice patterns with management
- PMID: 10310595
- PMCID: PMC4191363
Item in Clipboard
Health spending in the 1980's: integration of clinical practice patterns with management
Health Care Financ Rev.
1984 Spring.
Abstract
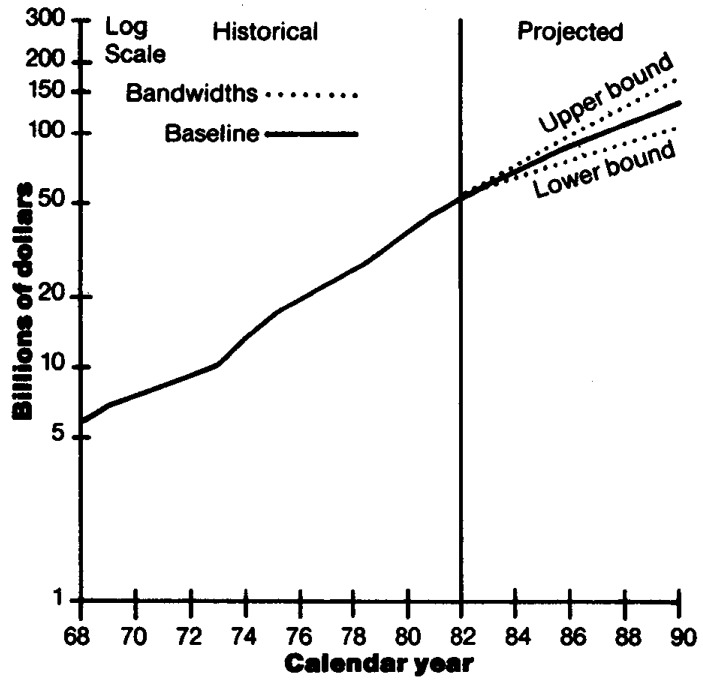
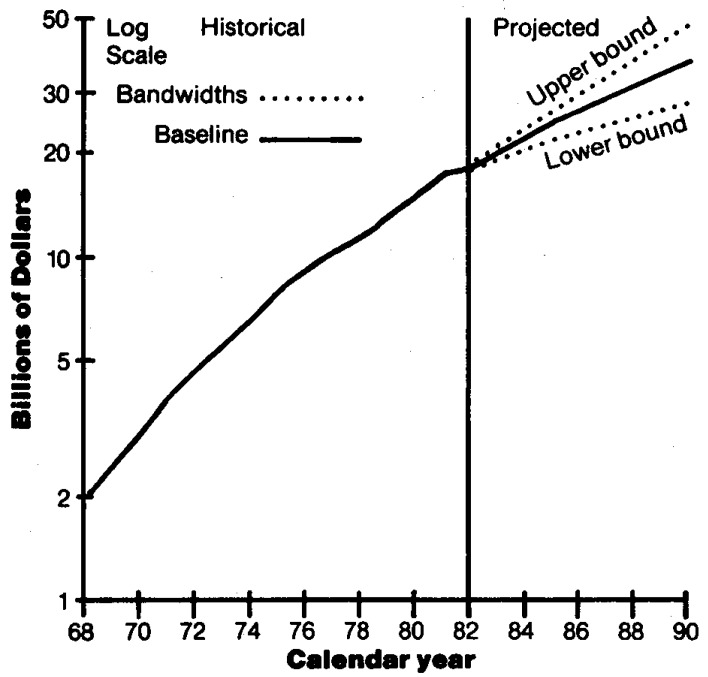
Health care spending in the United States more than tripled between 1972 and 1982, increasing from $94 billion to $322 billion. This growth substantially outpaced overall growth in the economy. National health expenditures are projected to reach approximately $690 billion in 1990 and consume roughly 12 percent of the gross national product. Government spending for health care is projected to reach $294 billion by 1990, with the Federal Government paying 72 percent. The Medicare prospective payment system and increasing competition in the health services sector are providing incentives to integrate clinical practice patterns with improved management practices.
Figures
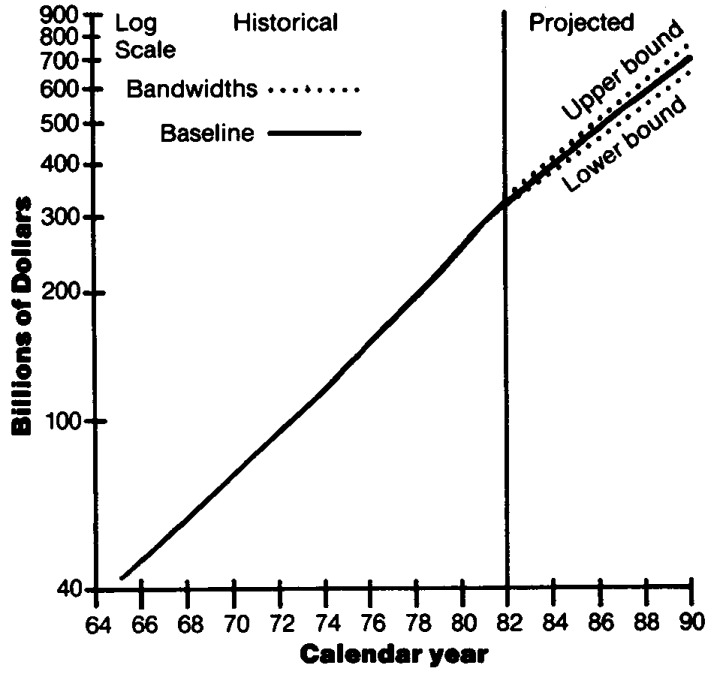
1The conditional bandwidths around the baseline projection scenario provide one indicator of variability. The standard error associated with annual percent increases in total national health expenditures for 1966-82 was multiplied by a t-distribution value of 2.12 to derive the conditional “95 percent” bandwidths. The calculated bandwidths are approximate and are used as a rough guide in assessing variability and uncertainty. It is important to keep in mind the potential dangers of extrapolating historical measures of variability into the future. That is, there can be no assurance that future variability will replicate historical variability. SOURCE: Health Care Financing Administration, Bureau of Data Management and Strategy, Office of Financial and Actuarial Analysis.
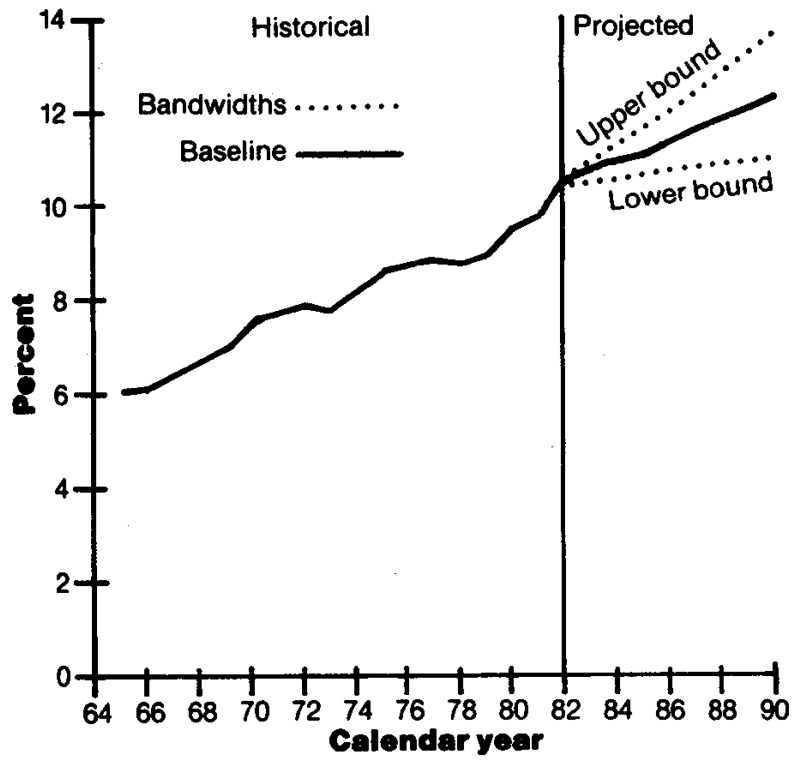
1The conditional bandwidths around the baseline projection scenario provide one indicator of variability. The standard error associated with annual percent increases in the ratio of national health expenditures to gross national product for 1966-82 was multiplied by a t-distribution value of 2.12 to derive the conditional “95 percent” bandwidths. The calculated bandwidths are approximate and are used as a rough guide in assessing variability and uncertainty. It is important to keep in mind the potential dangers of extrapolating historical measures of variability into the future. That is, there can be no assurance that future variability will replicate historical variability. SOURCE: Health Care Financing Administration, Bureau of Data Management and Strategy, Office of Financial and Actuarial Analysis.
1Outlays include benefits plus administrative expenses. 2The conditional bandwidths around the baseline projections scenario provide one indicator of variability. The standard error associated with annual percentage increases in Medicare outlays for 1969-1982 was multiplied by a t-distribution value of 2.16 to derive the conditional “95 percent” bandwidths. The calculated bandwidths are approximate and are used as a rough guide in assessing variability and uncertainty. It is important to keep in mind the potential dangers of extrapolating historical measures of variability into the future. That is, there can be no assurance that future variability will replicate historical variability. SOURCE: Health Care Financing Administration, Bureau of Data Management and Strategy, Office of Financial and Actuarial Analysis.
1Outlays include benefits plus administrative expenses. 2The conditional bandwidths around the baseline projections scenario provide one indicator of variability. The standard error associated with annual percent increases in Federal Medicaid outlays for 1969-1982 was multiplied by a t-distribution value of 2.16 to derive the conditional “95 percent” bandwidths. The calculated bandwidths are approximate and are used as a rough guide in assessing variability and uncertainty. It is important to keep in mind the potential dangers of extrapolating historical measures of variability into the future. That is, there can be no assurance that future variability will replicate historical variability. SOURCE: Health Care Financing Administration, Bureau of Data Management and Strategy, Office of Financial and Actuarial Analysis.
1Employer contributions for private health insurance premiums and for Federal hospital insurance (Medicare) taxes are included. Also see Table G. SOURCE: Health Care Financing Administration, Bureau of Data Management and Strategy, Office of Financial and Actuarial Analysis.
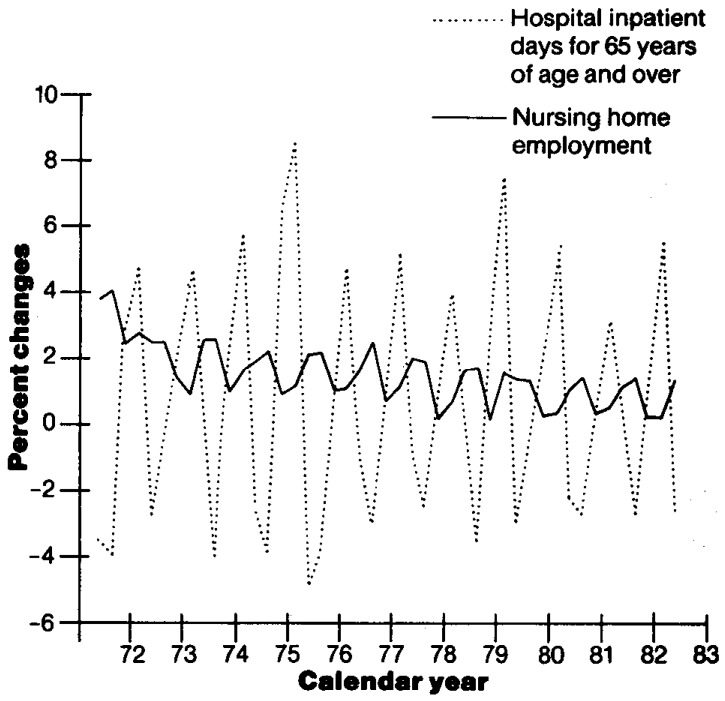
1Quarter-to-quarter percent changes are graphed, not percent changes from same quarter a year ago. 2Quarterly percent changes in nursing home employment was used as a rough indicator of changes in nursing home use (in the absence of use data). SOURCE: Health Care Financing Administration, Bureau of Data Management and Strategy, Office of Financial and Actuarial Analysis.
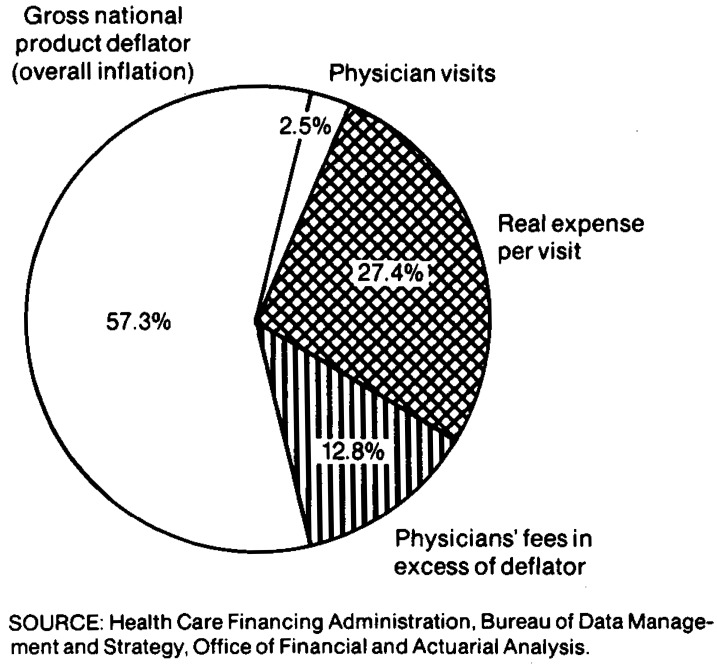
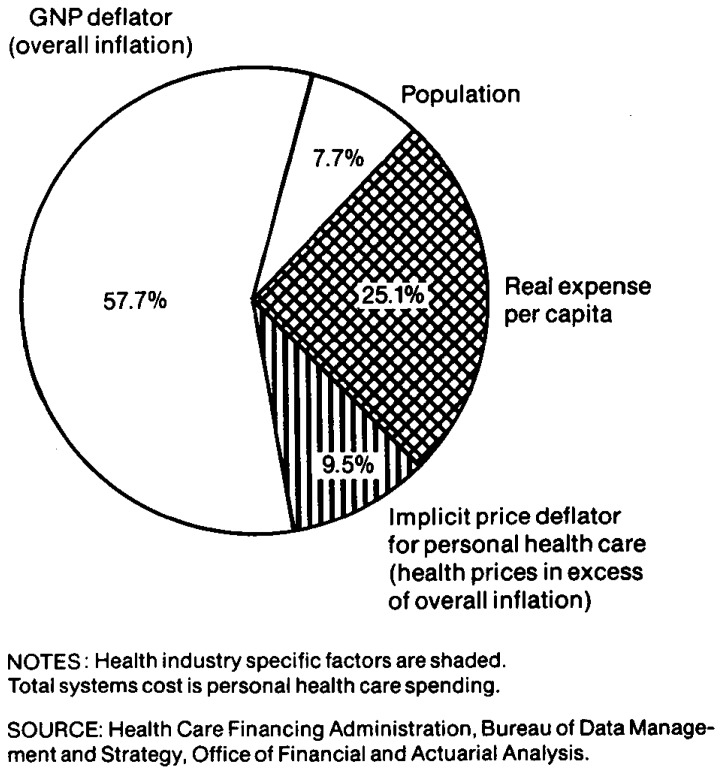
1Medical research expenditures of drug companies and manufacturers of medical supplies and equipment are excluded from the Health Care Financing Administration category of “medical research” but are included in the expenditure category in which the product falls. SOURCE: Health Care Financing Administration, Bureau of Data Management and Strategy, Office of Financial and Actuarial Analysis.
References
-
- Alhadeff DA. Microeconomics and Human Behavior: Toward a New Synthesis of Economics and Psychology. Berkeley, California: University of California Press; 1982.
-
- Allard MA, Toff G. Intergovernmental Health Policy Project. Washington, D.C.: George Washington University; Aug. 1980. Current and Future Development of Intermediate Care Facilities for the Mentally Retarded: A Survey of State Officials.
-
- Altman SH, Blendon R, editors. Medical Technology: The Culprit Behind Health Care Costs? Proceedings of the 1977 Sun Valley forum on national health; 1979. pp. 79–3216. DHEW Pub. No. (PHS)
-
- American Dental Association, Bureau of Economic and Behavioral Research. Changes in the prevalence of dental disease. Journal of the American Dental Association. 1982 Jul;105(1):75–79. - PubMed
-
- American Dental Association, Special Committee on the Future of Dentistry. Strategic Plan, Report of the American Dental Association's Special Committee on the Future of Dentistry. Chicago: American Dental Association; Jul, 1983.
MeSH terms
LinkOut - more resources
Full Text Sources
Molecular Biology Databases