

Health spending trends in the 1980's: adjusting to financial incentives
- PMID: 10311158
- PMCID: PMC4191479
Item in Clipboard
Health spending trends in the 1980's: adjusting to financial incentives
Health Care Financ Rev.
1985 Spring.
Abstract
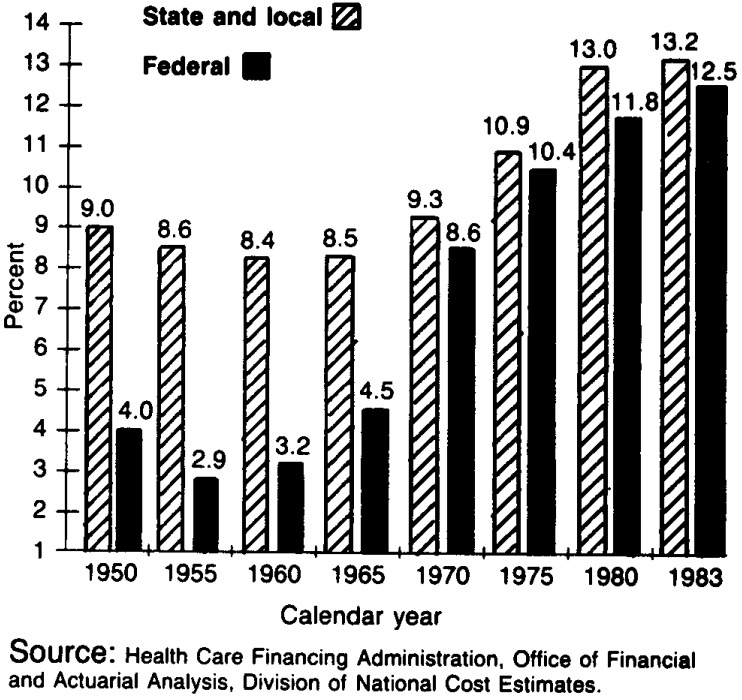
Health expenditure growth is projected to moderate considerably during 1983-90, reaching $660 billion in 1990 and consuming over 11 percent of the gross national product. During 1973-83, spending for health care more than tripled, increasing from $103 billion to $355 billion and moving from 7.8 percent to 10.8 percent of the gross national product. Government spending for health care is projected to reach $284 billion by 1990, with the Federal Government paying 73 percent. The Medicare Prospective Payment System, private sector initiatives, and State and local government actions are providing incentives to substantially increase competition and cost effectiveness in health care provision.
Figures
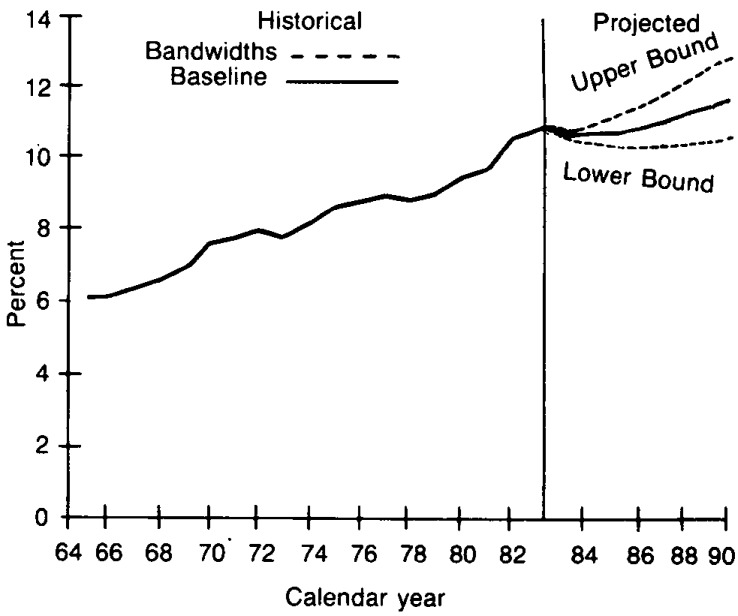
1The conditional bandwidths around (he baseline projection scenario provide one indicator 0(variability. The standard error associated with annual percent increases in the ratio of national health expenditures to gross national product for 1966-83 was multiplied by a t-distribution value of 2.11 to derive the conditional “95 percent” bandwidths. The calculated bandwidfhs are approx-imate and are used as a rough guide in assessing variability and uncertainty. It is important to keep in mind the potential dangers of exfrapolating historical measures of variability into the future; that is, there can be no assurance that future variability will replicate historical variability. SOURCE: Health Care Financing Administration, Office of Financial and Actuarial Analysis, Division of National Cost Estimates.
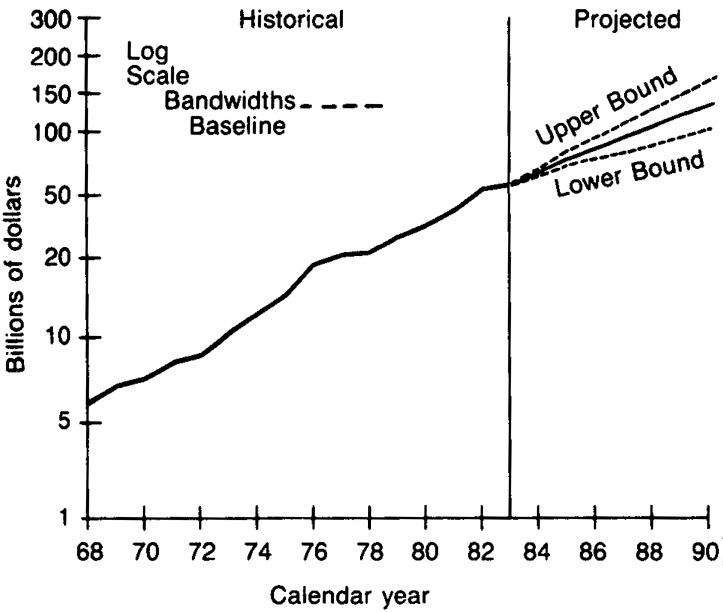
1Outlays include benefits plus administrative expenses. 2The conditional bandwidths around the baseline projection scenario provide one indicator of variability. The standard error associated with annual percent increases in Medicare outlays (for 1969-83 was multiplied by a t-distribution value of 2.145 to derive the conditional “95 percent” bandwidths. The calculated bandwidths are approximate and are used as a rough guide in assessing variability and uncertainty. It is important to keep in mind the potential dangers of extrapolating historical measures of variability into the future; that is, there can be no assurance that future variability will replicate historical variability. SOURCE: Health Care Financing Administration, Office of Financial and Acuarial Analysis, vision of National Cost Estimates.
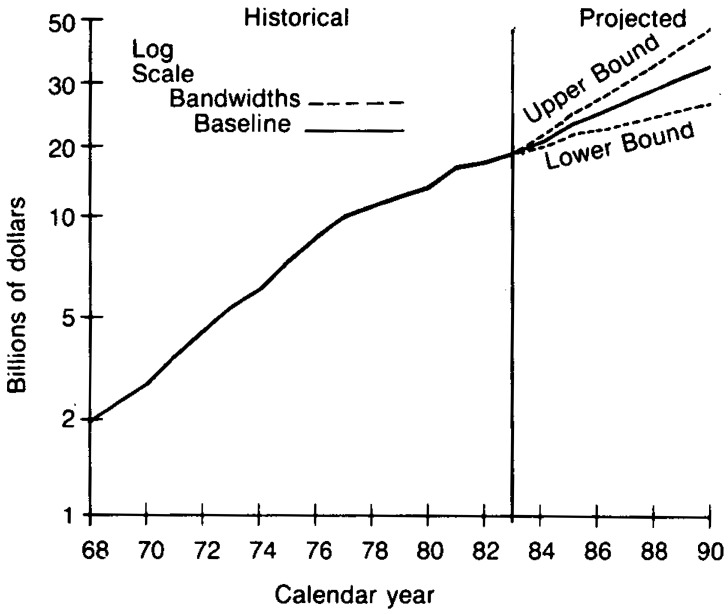
1Outlays include benefits plus administrative expenses. 2The conditional bandwidths around the baseline projection scenario provide one indicator of variability. The standard error associated with annual percent increases in Medicare outlays (for 1969-83 was multiplied by a t-distribution value of 2.145 to derive the conditional “95 percent” bandwidths. The calculated bandwidths are approximate and are used as a rough guide in assessing variability and uncertainty. It is important to keep in mind the potential dangers of extrapolating historical measures of variability into the future; that is, there can be no assurance that future variability will replicate historical variability. SOURCE: Health Care Financing Administration, Office of Financial and Acuarial Analysis, vision of National Cost Estimates.
References
-
- Aaron HJ, Schwartz WB. The Painful Prescription: Rationing Hospital Care. Washington, D.C.: The Brookings Institutions; 1984.
-
- Arnett RH, III, Trapnell GR. Health Care Financing Review. Washington: U.S. Government Printing Office; Winter. 1984. Private health insurance: new measures of a complex and changing industry. HCFA Pub. No. 03177. Office of Financial and Actuarial Analysis, Health Care Financing Administration. - PMC - PubMed
-
- Bandy WC. 1984 US Industrial Outlook Prospects for Over 300 Industries. Bureau of Industrial Economics, U.S. Department of Commerce; Washington: Jan, 1984. Medical and dental instruments and supplies.
-
- Benham L. The effect of advertising on the price of eyeglasses. Journal of Law and Economics. 1972 Oct;:337–352.
-
- Blumberg MS. Provider price changes for improved health care use. In: Chacko GK, editor. Health Handbook. Amsterdam, Holland: North Holland Press; 1979.
MeSH terms
LinkOut - more resources
Full Text Sources