. 1987 Summer;8(4):1-36.

National health expenditures, 1986-2000

National health expenditures, 1986-2000

Division of National Cost Estimates, Office of the Actuary, Health Care Financing Administration. Health Care Financ Rev. 1987 Summer.

Abstract

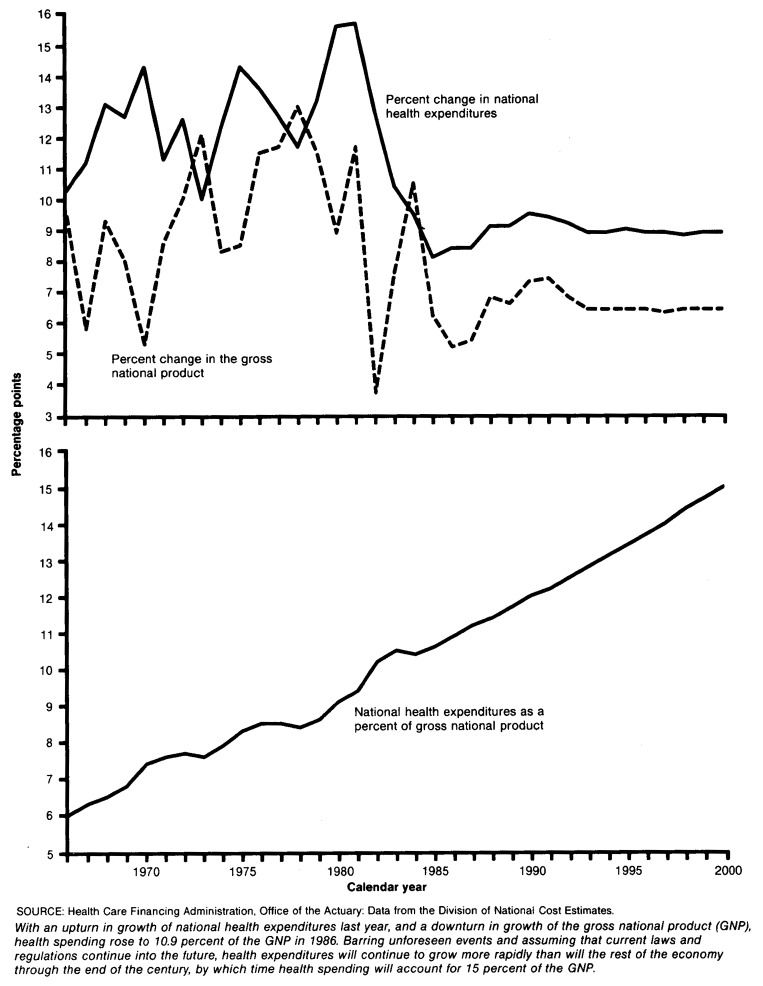
Patterns of spending for health during 1986 and beyond reflect a mixture of adherence to and change from historical trends. From a level of $458 billion in 1986--10.9 percent of the GNP--national health expenditures are projected to reach $1.5 trillion by the year 2000--15.0 percent of the GNP. This article presents a provisional estimate of spending in 1986 and projections of spending (under the assumption of current law) through the year 2000. Also discussed are the effects of the demographic composition of the population on spending for health, and how spending would increase in the future simply as a result of the evolution of that composition.


Figures

Figure 1
Figure 1. Percent change in national health expenditures and gross national product, and national health expenditures as a percent of gross national product: Calendar years 1966-86 and projections 1987-2000
Figure 2
Figure 2. The Nation's health dollar: 1986
Figure 3
Figure 3. Annual percent change in selected components of private nonagricultural employment, work hours, and payroll: 1966-86
Figure 4
Figure 4. Hospital employment as a percent of health industry employment: Calendar years 1965-86
Figure 5
Figure 5. Percent change in the Consumer Price Index from the same quarter of the previous year for hospital services, physician services, and all items less medical care: Calendar years 1961-87
Figure 6
Figure 6. Number of community hospital admissions and inpatient days for populations under age 65 and 65 years of age or over: Calendar years 1967-86
Figure 7
Figure 7. Number of community hospital inpatient days, outpatient visits, and surgical operations: 1967-86
Figure 8
Figure 8. Factors affecting change in personal health care expenditures of billions of dollars: Calendar years 1966-86
Figure 9
Figure 9. Annual percent change in real personal health care expenditures: Calendar years 1966-86

References

    1. American Hospital Association. Data from the National Hospital Panel Survey. Chicago: 1987.
    1. Bezold C, editor. Pharmaceuticals in the Year 2000: The Changing Context for Drug R&D. Alexandria, Va.: Institute for Alternative Futures; 1983.
    1. Congressional Budget Office. Physician Reimbursement Under Medicare: Options for Change. Washington: Congress of the United States; Apr. 1986.
    1. Coolfont Report: A PHS plan for prevention and control of AIDS and the AIDS virus. Public Health Reports. 1986 Jul-Aug;101(4):341–348. - PMC - PubMed
    1. Fisher CR. Health Care Financing Review. No. 4. Vol. 1. Washington: U.S. Government Printing Office; Spring. 1980. Differences by age groups in health care spending. HCFA Pub. No. 03045. Office of Research, Demonstrations, and Statistics, Health Care Financing Administration. - PMC - PubMed