. 1999 May 11;96(10):5394-9.
doi: 10.1073/pnas.96.10.5394.

Clonal selection and in vivo quantitation of protein interactions with protein-fragment complementation assays

Affiliations

Clonal selection and in vivo quantitation of protein interactions with protein-fragment complementation assays

I Remy et al. Proc Natl Acad Sci U S A. .

Erratum in

  • Proc Natl Acad Sci U S A 1999 Jun 22;96(13):7610

Abstract

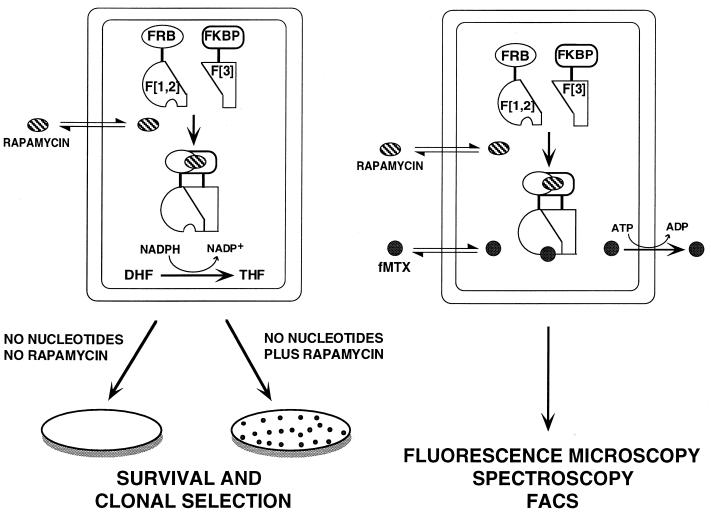
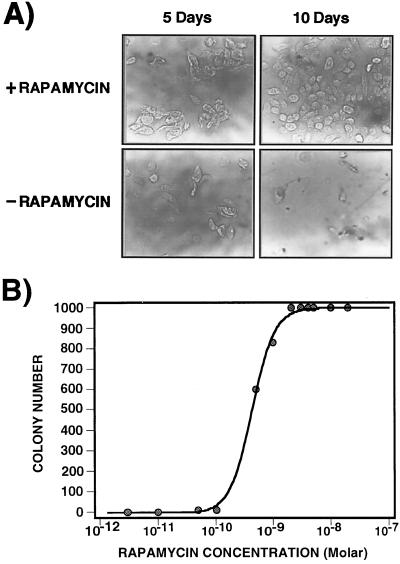
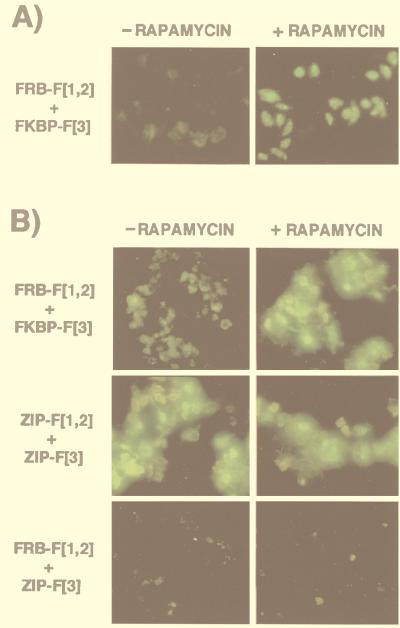
Two strategies are described for detecting constitutive or induced protein-protein interactions in intact mammalian cells; these strategies are based on oligomerization domain-assisted complementation of rationally designed fragments of the murine enzyme dihydrofolate reductase (DHFR; EC 1.5.1.3). We describe a dominant clonal-selection assay of stably transfected cells expressing partner proteins FKBP (FK506 binding protein) and FRAP (FKBP-rapamycin binding protein) fused to DHFR fragments and show a rapamycin dose-dependent survival of clones that requires approximately 25 molecules of reconstituted DHFR per cell. A fluorescence assay also is described, based on stoichiometric binding of fluorescein-methotrexate to reconstituted DHFR in vivo. Formation of the FKBP-rapamycin-FRAP complex is detected in stably and transiently transfected cells. Quantitative rapamycin dose-dependence of this complex is shown to be consistent with in vitro binding and distinguishable from a known constitutive interaction of FKBP and FRAP. We also show that this strategy can be applied to study membrane protein receptors, demonstrating dose-dependent activation of the erythropoietin receptor by ligands. The combination of these clonal-selection and fluorescence assays in intact mammalian cells makes possible selection by simple survival, flow cytometry, or both. High-throughput drug screening and quantitative analysis of induction or disruption of protein-protein interactions are also made possible.


Figures

Figure 1
Figure 1
Schematic representation of the strategy used to study the FKBP–rapamycin–FRB complex. (Left) FKBP and FRB are fused to one of the two complementary fragments of murine DHFR (F[1,2] and F[3]) to generate FRB–F[1,2] and FKBP–F[3]. The addition of rapamycin induces the association of FKBP with FRB, which in turn drives the reconstitution of DHFR (F-[1,2] + F-[3]), allowing DHFR-negative cells expressing these constructs to grow in medium lacking nucleotides. (Right) The fluorescence assay is based on high-affinity binding of the specific DHFR inhibitor fMTX to reconstituted DHFR. fMTX passively crosses the cell membrane, binds to reconstituted DHFR, and is thus retained in the cell. Unbound fMTX is released rapidly from the cells by active transport. Detection of bound and retained fMTX can then be detected by fluorescence microscopy, FACS, or fluorescence spectroscopy.
Figure 2
Figure 2
Survival selection of CHO DUKX-B11 cells expressing FRB–F[1,2] and FKBP–F[3]. (A) CHO DUKX-B11(DHFR) cells were stably transfected with FRB–F[1,2] and FKBP–F[3] and selected in medium without nucleotides, rendering cells dependent on exogenous DHFR activity. Rapamycin was added to the cells at a final concentration of 10 nM to induce the association of FKBP with FRB (reconstitution of DHFR activity). Photos of cells were taken after 5 and 10 days of incubation in the selective medium in the presence (Upper) or in the absence (Lower) of rapamycin. (B) Survival selection curve showing that colony formation depends on the concentration of rapamycin. Stably transfected CHO DUKX-B11 cells expressing FRB–F[1,2] and FKBP–F[3] were split in different concentrations of rapamycin from 0 nM to 20 nM in selective medium without nucleotides. The number of colonies was established after 4 days of incubation in selective medium.
Figure 3
Figure 3
Fluorescence microscopy of cells expressing FRB–F[1,2] and FKBP–F[3]. (A) CHO DUKX-B11 cells stably expressing the fusions were incubated with fMTX at a final concentration of 10 μM, with or without addition of 20 nM rapamycin, for 22 h at 37°C. (B) COS-7 cells were transiently transfected with the fusions and treated and analyzed by fluorescence microscopy as in A. Controls include the positive interaction by leucine zipper formation (ZIP–F[1,2] + ZIP–F[3]) and negative controls for noninteracting pairs (FRB–F[1,2] + ZIP–F[3]; ZIP–F[1,2] + FKBP–F[3], not shown).
Figure 4
Figure 4
Flow cytometric analysis, dose-response, and competition curves of CHO DUKX-B11 cells labeled with fMTX. (A) Induced formation of FKBP–rapamycin–FRB complex was monitored by fluorescence flow cytometry. The gray histogram corresponds to cells expressing FRB–F[1,2] and FKBP–F[3] that had been treated overnight with 20 nM rapamycin. The white histogram corresponds to untreated cells. (B) The dose-response curve for rapamycin was based on flow cytometric analysis of CHO DUKX-B11 cells expressing the same fusions. Mean fluorescence intensities were determined for three independent samples at each rapamycin concentration (between 0.1 nM and 300 nM). (C) Competition curve with the inhibitor FK506, an analog of rapamycin. Mean fluorescence intensities were determined for three independent samples at each inhibitor concentration (between 0 μM and 6 μM, corresponding to a ratio of rapamycin:FK506 of 1:0 to 1:300; closed circles). The concentration of rapamycin was kept constant at 20 nM. As a control, mean fluorescence intensities also were determined for each concentration of FK506 in the absence of rapamycin (open triangles).
Figure 5
Figure 5
Fluorescence microscopy and dose-response curves of CHO DUKX-B11 cells expressing EpoR(1–270)–DHFR fragment fusions. (A) CHO DUKX-B11 cells were stably transfected with EpoR(1–270)–F[1,2] and EpoR(1–270)–F[3] and grown in selective medium in the presence of 2 nM Epo. For microscopy, cells were incubated with fMTX as described for Fig. 3A and then treated with 10 nM Epo or 10 μM EMP1 for 30 min at 37°C. (B) Dose-response curves for Epo and EMP1 were based on flow cytometric analysis of CHO DUKX-B11 cells expressing the same fusions. Mean fluorescence intensities were determined for three separate samples at each ligand concentration: between 0.0003 nM and 100 nM for Epo (triangles) or between 0.0003 μM and 100 μM for EMP1 (circles).

References

    1. Reed L J. Acc Chem Res. 1974;7:40–46.
    1. Perham R N. Philos Trans R Soc London B. 1975;272:123–136. - PubMed
    1. Fields S, Song O. Nature (London) 1989;340:245–246. - PubMed
    1. Johnsson N, Varshavsky A. Proc Natl Acad Sci USA. 1994;91:10340–10344. - PMC - PubMed
    1. Pelletier J N, Michnick S W. Protein Eng. 1997;10:89. - PubMed

Publication types

MeSH terms

LinkOut - more resources