. 1999 May 11;96(10):5692-7.
doi: 10.1073/pnas.96.10.5692.

Quantitative analysis of hepatitis C virus-specific CD8(+) T cells in peripheral blood and liver using peptide-MHC tetramers

Affiliations

Quantitative analysis of hepatitis C virus-specific CD8(+) T cells in peripheral blood and liver using peptide-MHC tetramers

X S He et al. Proc Natl Acad Sci U S A. .

Abstract

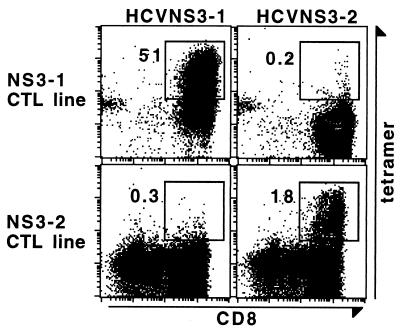
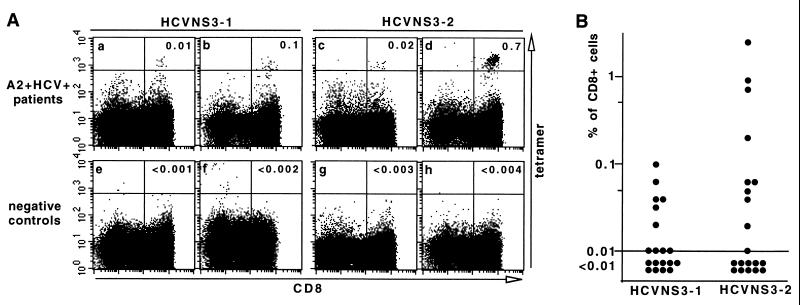
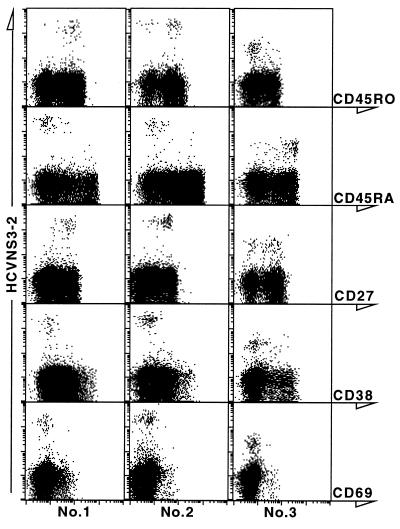
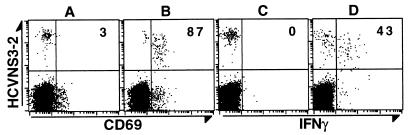
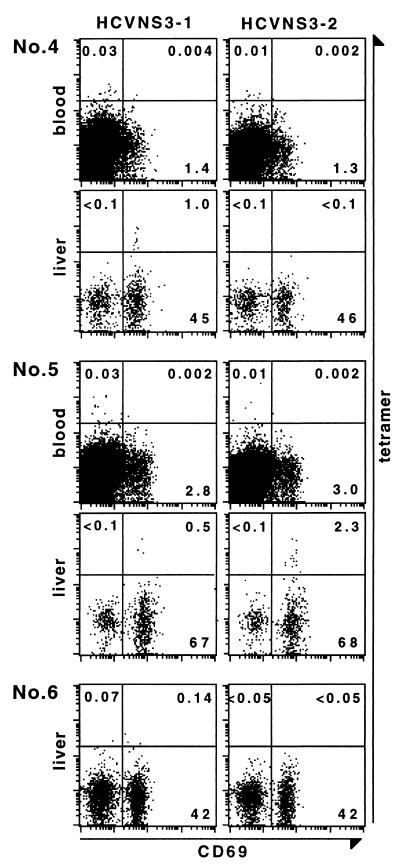
It is believed that the hepatitis C virus (HCV)-specific CD8(+) cytotoxic T lymphocytes (CTLs) play a role in the development of liver cell injury and in the clearance of the virus. To develop a direct binding assay for HCV-specific CTLs, we generated two peptide-MHC tetramers by using the recombinant HLA A2.1 molecule and A2-restricted T cell epitopes of the HCV NS3 protein. With these reagents we are able to detect specific CD8(+) cells in the blood of 15 of 20 HLA-A2(+), HCV-infected patients, at a frequency ranging from 0.01% to 1.2% of peripheral CD8(+) T cells. Phenotypic analysis of these specific cells indicated that there is a significant variation in the expression of the CD45 isoforms and CD27 in different patients. A 6-hour incubation of one patient's blood with NS3 peptides resulted in the activation of the epitope-specific CD8(+) cells, as indicated by their expression of CD69 and IFN-gamma. We also detected NS3-specific CD8(+) T cells in the intrahepatic lymphocyte population isolated from liver biopsies of two HCV-infected patients. The frequency of these specific CD8(+) cells in the liver was 1-2%, at least 30-fold higher than in the peripheral blood. All of the intrahepatic NS3-specific CD8(+) T cells were CD69(+), suggesting that they were activated CTLs. Direct quantitation and characterization of HCV-specific CTLs should extend our understanding of the immunopathogenesis and the mechanism of clearance or persistence of HCV.


Figures

Figure 1
Figure 1
Binding specificity of tetramers HCVNS3-1 and HCVNS3-2. NS3 epitope-specific CTL lines were generated by stimulating PBMCs from anti-HCV seropositive individuals with peptides NS3-1 or NS3-2 for 3 weeks. Cytotoxicity of the two lines was determined by 51Cr-release assay, by using peptide-loaded JY-EBV cells as targets. At effector:target = 60:1, the specific lysis by the NS3-1 CTL line was 56%, whereas that by the NS3-2 CTL line was 45%. Spontaneous release as well as nonspecific lysis of target cells was lower than 10%. The CTL lines were stained and analyzed with a three-color flow cytometric assay, by using tetramers HCVNS3-1 or HCVNS3-2 along with mAbs to CD8, CD4, CD13, and CD19. Displayed in the dot plots are lymphocytes which are CD4CD13CD19. The number next to the box is the percentage of tetramer-binding cells of total CD8+ cells.
Figure 2
Figure 2
Detection of NS3-specific CD8+ cells in the peripheral blood of chronically infected patients. (A) PBMCs from A2+HCV+ patients (ad) and control individuals (e and g, A2+HCV; f and h, A2HCV+) were stained and analyzed in parallel as described in the legend of Fig. 1, except that a higher cutoff value for fluorescence intensity of the tetramer-binding cells was used to distinguish the tetramer+ cell populations. The number of CD8+ cells acquired from each staining experiment was 2 × 10⁴–1 × 10⁵. The number in the upper-right quadrant is the percentage of tetramer-binding cells of total CD8+ cells. (B) PBMCs from 20 A2+HCV+ individuals were stained and analyzed to determine frequency of tetramer+CD8+ T cells in the peripheral blood of each patient. One of the patients was tested with HCVNS3-2 only. A frequency lower than 0.01% is considered negative.
Figure 3
Figure 3
Surface phenotype of NS3-specific peripheral CD8+ cells. PBMCs from patients 1, 2, and 3 were analyzed with a four-color flow cytometric assay, by using the tetramer HCVNS3-2, mAbs to CD8, CD4, CD13, and CD19, and one of the mAbs against the following markers: CD45RO, CD45RA, CD27, CD38, and CD69. Displayed in the dot plots are CD8+ lymphocytes which are CD4CD13CD19.
Figure 4
Figure 4
Antigen-specific activation of NS3-specific peripheral CD8+ cells. Aliquots of heparinized whole blood were incubated with 10 μg/ml HCV peptides NS3–1 (A and C) or NS3-2 (B and D), 1 μg/ml anti-CD28 and 1 μg/ml anti-CD49d (both from Becton Dickinson) at 37°C for 6 hours, with addition of brefeldin A (Sigma) at 10 μg/ml during the last 4 hours, as described (24, 25). The cells were processed and stained with tetramer HCVNS3-2 and antibodies by using a modified procedure (unpublished data; ref. 24). In brief, the cells were stained with tetramer first, followed by lysing red blood cells with FACS Lysing Solution and permeabilyzing white blood cells with FACS Permeabilizing Solution (both from Becton Dickinson). The processed cells were then stained and analyzed as described in the legend of Fig. 3. The number in the upper right quandrant is the percentage of CD69+ or IFN-γ+ cells of the total tetramer+CD8+ cells.
Figure 5
Figure 5
NS3-specific CD8+ cells in the HCV-infected livers. LILs were isolated from needle biopsies of A2+HCV+ patients 4 and 5 and A2HCV+ patient 6 (negative control). The biopsies of patients 4 and 6 showed lesions compatible with mild chronic hepatitis, whereas that of patient 5 was compatible with severe chronic hepatitis. Cells were stained and analyzed with a four-color flow cytometric assay, by using tetramers HCVNS3-1 or HCVNS3-2 in addition to antibodies to CD8, CD4, CD13, CD19, and CD69. PBMCs from patients 4 and 5 were analyzed in parallel with the LIL samples. Displayed in the dot plots are CD8+ lymphocytes which are CD4CD13CD19. Numbers in the upper left, upper right, and lower right quadrants indicate percentage of tetramer+CD69, tetramer+CD69+, and tetramerCD69+ cells of total CD8+ cells, respectively.

References

    1. Choo Q L, Kuo G, Weiner A J, Overby L R, Bradley D W, Houghton M. Science. 1989;244:359–362. - PubMed
    1. Alter M J. Semin Liver Dis. 1995;15:5–14. - PubMed
    1. Walker C M. Semin Virol. 1996;7:13–21.
    1. Koziel, M. J. (1997) J. Viral. Hepat.4, Suppl. 2, 31–41. - PubMed
    1. Rehermann B, Chang K M, McHutchinson J, Kokka R, Houghton M, Rice C M, Chisari F V. J Virol. 1996;70:7092–7102. - PMC - PubMed

Publication types

MeSH terms