. 1999 May 11;96(10):5728-33.
doi: 10.1073/pnas.96.10.5728.

Suppression of angiogenesis and tumor growth by the inhibitor K1-5 generated by plasmin-mediated proteolysis

Affiliations

Suppression of angiogenesis and tumor growth by the inhibitor K1-5 generated by plasmin-mediated proteolysis

R Cao et al. Proc Natl Acad Sci U S A. .

Abstract

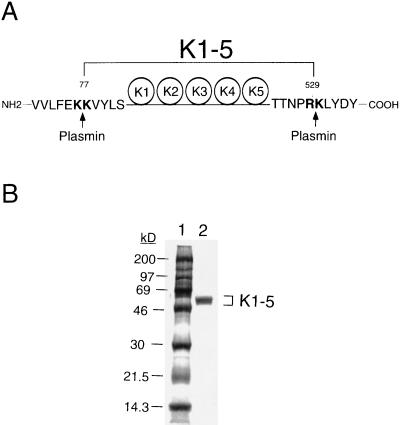
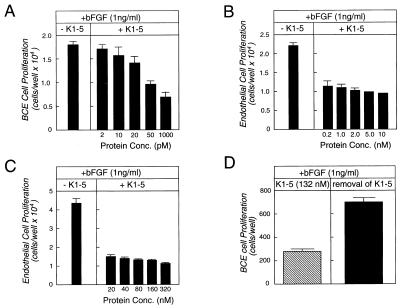
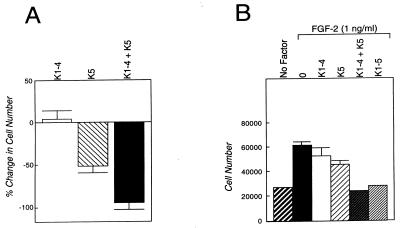
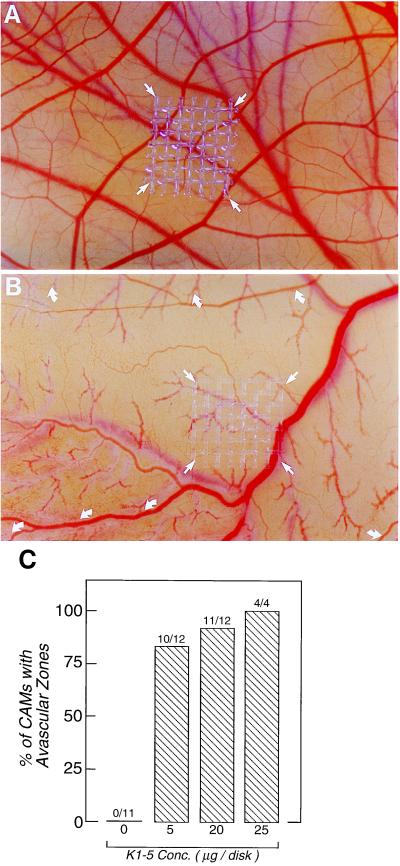
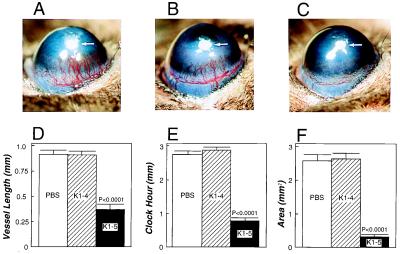
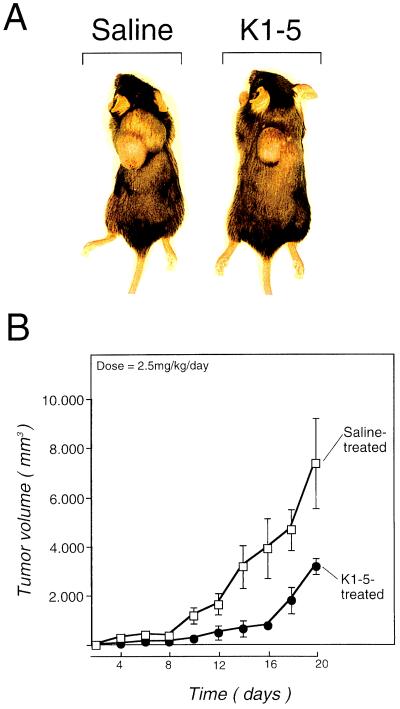
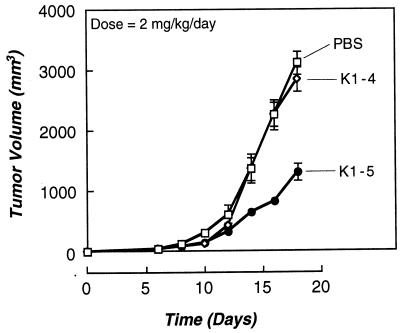
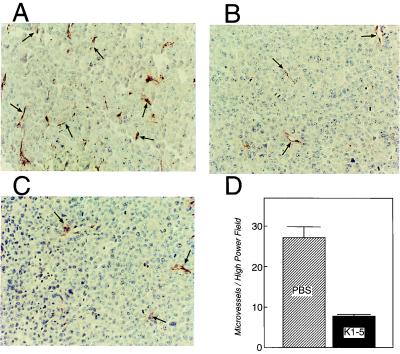
Proteolytic enzymes are involved in generation of a number of endogenous angiogenesis inhibitors. Previously, we reported that angiostatin, a potent angiogenesis inhibitor, is a proteolytic fragment containing the first four kringle modules of plasminogen. In this report, we demonstrate that urokinase-activated plasmin can process plasminogen to release an angiogenesis inhibitor, K1-5 (protease-activated kringles 1-5). K1-5 inhibits endothelial-cell proliferation with a half-maximal concentration of approximately 50 pM. This inhibitory effect is endothelial-cell-specific and appears to be at least approximately 50-fold greater than that of angiostatin. A synergistic efficacy of endothelial inhibition was observed when angiostatin and kringle 5 (K5) were coincubated with capillary endothelial cells. The synergistic effect is comparable to that produced by K1-5 alone. Systemic treatment of mice with K1-5 at a low dose significantly blocked the fibroblast growth factor-induced corneal neovascularization, whereas angiostatin had no effect at the same dose. K1-5 also suppressed angiogenesis in chicken embryos. Systemic administration of K1-5 at a low dose at which angiostatin was ineffective significantly suppressed the growth of a murine T241 fibrosarcoma in mice. The antitumor effect correlates with the reduced neovascularization. These findings suggest that the plasmin-mediated proteolysis may be involved in the negative switch of angiogenesis.


Figures

Figure 1
Figure 1
Proteolytic fragment of human K1–5. (A) Plasmin cleavage sites. K1–5 fragment can be released by digestion of human Glu1-Pgn with urokinase-activated plasmin. N- and C-terminal sequencing analyses of purified K1–5 revealed that cleavage sites of plasmin were dibasic amino acids between Lys76 and Lys77 at the N terminus and between Arg529 and Lys530 at the C terminus, as indicated by arrows. K1–5 contains K1–4 and most part of K5 structures of Pgn. (B) SDS/PAGE analysis. The plasmin-digested K1–5 was purified by lysine-Sepharose affinity chromatography, followed by filtration through a Sephadex G-75 column. Four micrograms of purified protein were analyzed on a 10–20% gradient gel by SDS/PAGE under reducing conditions, followed by staining with Coomassie blue. K1–5 with molecular mass of 55 kDa was purified to homogeneity (lane 2). The molecular mass markers are indicated (in kDa) in lane 1.
Figure 2
Figure 2
Inhibition of endothelial-cell proliferation. Purified K1–5 at various concentrations was assayed on BCE cells in the presence of FGF-2 (1 ng/ml) in a 72-h proliferation experiment. (A) K1–5 displays a dose-dependent effect on suppression of BCE cell growth. (B and C) The maximal inhibitory activity was detected at 200 pM. Increase of concentrations does not enhance the inhibitory effect. (D) The inhibitory activity of K1–5 on BCE cells was reversible and endothelial cells regrew after removal of K1–5. Values represent the mean ± SEM of triplicate of each sample.
Figure 3
Figure 3
Synergistic inhibition of endothelial cell proliferation by angiostatin and K5. (A) Angiostatin (K1–4), K5, and the combination of these two inhibitory fragments at a concentration of 1 nM were assayed on BCE cells in the presence of FGF-2 (1 ng/ml) for 72 h. Each sample was assayed as a triplicate. Values represent the mean ± SEM of three determinations as percent change of cell number. (B) Kringle 1–4, K5, K1–4 + K5, K1–5 at a concentration of 1 nM were added to BCE cells in the presence of FGF-2 (1 ng/ml) for 72 h. Each sample was assayed as a triplicate. Values represent the mean ± SEM of a triplicate of each sample as cell numbers. BCE cell proliferation in the presence and absence of FGF-2 served as controls.
Figure 4
Figure 4
Inhibition of angiogenesis by K1–5 on the CAM. Methylcellulose discs containing various amounts of K1–5 were dried on a nylon mesh (4 × 4 mm). The meshes were implanted on CAMs of 6-day chicken embryos as described (31, 32). After 48 h, the formation of avascular zones was analyzed under a stereomicroscope. (A) A control CAM with a methylcellulose disc (white arrows) containing PBS. (B) Micrograph of an example of K1–5-implanted CAM. The formation of the avascular zone is marked by curved arrows. White arrows point to the implanted disk. Restriction and regression of blood vessel growth can be observed in the avascular zone area. (C) The number of avascular zones over the total number of CAMs tested at various concentrations of K1–5 is indicated above each bar.
Figure 5
Figure 5
Inhibition of mouse corneal neovascularization. Pellets containing sucrose aluminum sulfate, hydron, and 80 ng of FGF were implanted into corneal micropockets of mice. Corneas were photographed with a stereomicroscope on day 6 after FGF implantation and positions of implanted pellets were indicated by arrows in A–C. (A) Cornea of a control mouse receiving daily subcutaneous injection of PBS. (B) An example of the mouse cornea treated with daily subcutaneous injections of K1–4 (2 mg/kg). (C) An example of the mouse cornea treated with daily subcutaneous injections of K1–5 (2 mg/kg). Five mice of each treated and control group were used. (D) Maximal vessel length. (E) Clock hours of circumferential neovascularization. (F) Area of neovascularization. All data in D–F are presented as the mean ± SEM from 10 corneas in each group.
Figure 6
Figure 6
Suppression of tumor growth in syngeneic C57BL6/J. Male C57BL6/J syngeneic mice were subcutaneously implanted with 1 × 10⁶ T241 tumor cells per mouse and systemically treated with K1–5 by subcutaneous injections in the abdomen at the dose of 2.5 mg/kg once daily from day 0 through day 20. (A) Graphs of T241 fibrosarcoma-bearing mice treated with PBS (Left) and K1–5 (Right) at day 20 after treatment. (B) Tumor volumes of K1–5-treated group (●) vs. control saline-treated group (□) on days indicated. Data represent the tumor volume (mean ± SEM) from four or five mice in each group.
Figure 7
Figure 7
Comparison of the antitumor effect of K1–5 with that of angiostatin. Male C57BL6/J syngeneic mice were subcutaneously implanted with 1 × 10⁶ T241 tumor cells per mouse and systemically treated with K1–5 by subcutaneous injections in the abdomen at the dose of 2 mg/kg once daily from day 0 through day 18. Tumor volumes of K1–5-treated group (●) vs. control saline-treated group (□) and angiostatin-treated group (◊) on days indicated. Data represent the tumor volume (mean ± SEM) of five mice in each group.
Figure 8
Figure 8
Immunohistochemical analysis of neovascularization of primary tumors. T241 tumor bearing C57BL6/J mice were systemically treated with K1–5 (B and C) and control saline (A), and primary tumors were resected on day 20 after treatment. Tumor histological sections were stained with a polyclonal antibody against von Willebrand factor. Neovascularization of tumors was revealed by the antibody (brown staining pointed to by arrows). (D) Microvessel density per high-power field (×40) of K1–5-treated (solid bar) and saline-treated (hatched bar). Data are the mean ± SEM. Microvessels were counted from six randomly selected fields in tumors from three mice of each group. The values are significantly different (P < 0.0001).

Similar articles

Cited by

References

    1. Folkman J, Shing Y. J Biol Chem. 1992;267:10931–10934. - PubMed
    1. Folkman J, D′Amore P. Cell. 1996;87:1153–1155. - PubMed
    1. Risau W. Nature (London) 1997;386:671–674. - PubMed
    1. Hanahan D, Folkman J. Cell. 1996;86:353–364. - PubMed
    1. O’Reilly M S, Holmgren L, Shing Y, Chen C, Rosenthal R A, Moses M, Lane W S, Cao Y, Sage E H, Folkman J. Cell. 1994;79:315–328. - PubMed

Publication types

MeSH terms