. 1999 May;9(5):506-13.

Inventory of high-abundance mRNAs in skeletal muscle of normal men

Affiliations

Inventory of high-abundance mRNAs in skeletal muscle of normal men

S Welle et al. Genome Res. 1999 May.

Abstract

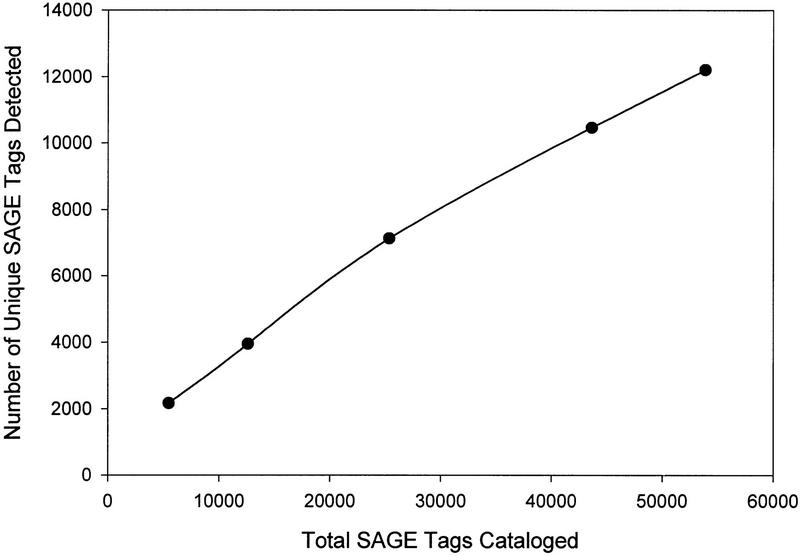
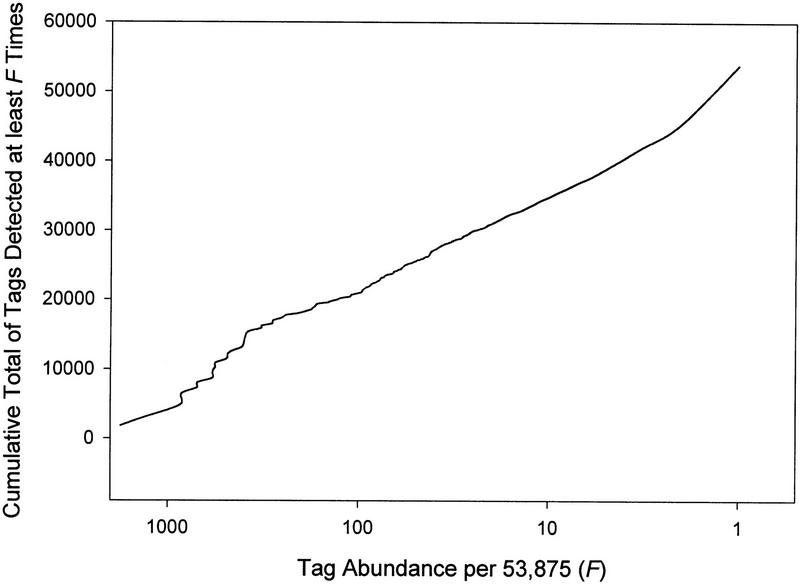
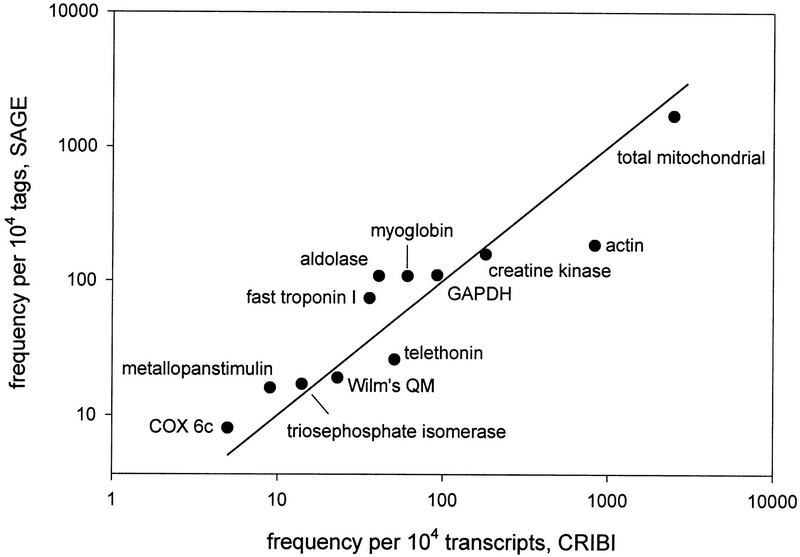
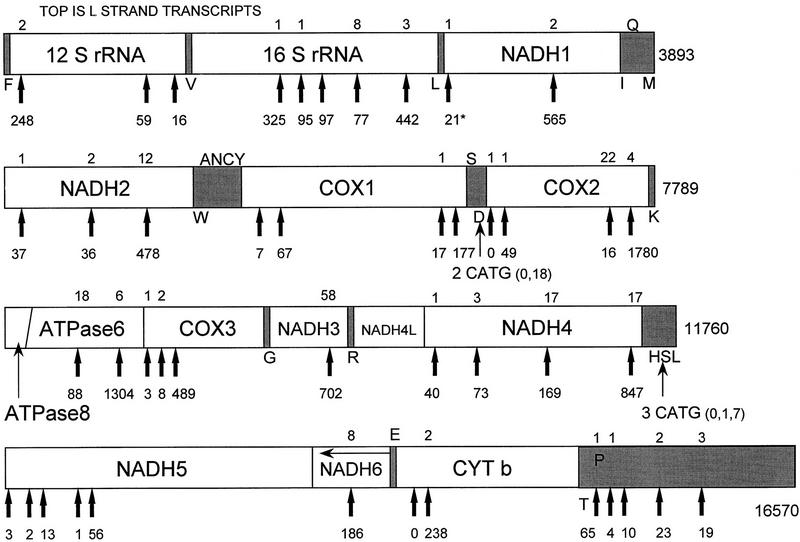
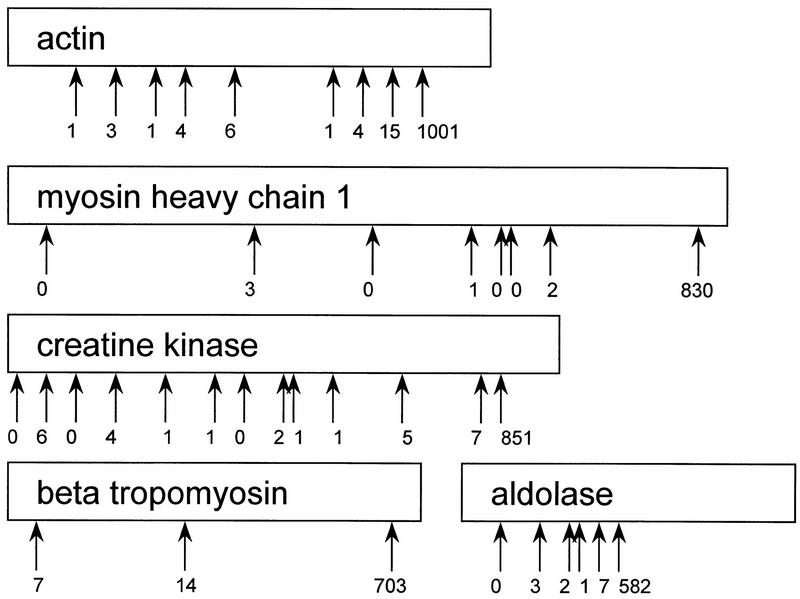
G42875rial analysis of gene expression (SAGE) method was used to generate a catalog of 53,875 short (14 base) expressed sequence tags from polyadenylated RNA obtained from vastus lateralis muscle of healthy young men. Over 12,000 unique tags were detected. The frequency of occurrence of each tag reflects the relative abundance of the corresponding mRNA. The mRNA species that were detected 10 or more times, each comprising >/=0.02% of the mRNA population, accounted for 64% of the mRNA mass but <10% of the total number of mRNA species detected. Almost all of the abundant tags matched mRNA or EST sequences cataloged in GenBank. Mitochondrial transcripts accounted for approximately 20% of the polyadenylated RNA. Transcripts encoding proteins of the myofibrils were the most abundant nuclear-encoded mRNAs. Transcripts encoding ribosomal proteins, and those encoding proteins involved in energy metabolism, also were very abundant. The database can be used as a reference for investigations of alterations in gene expression associated with conditions that influence muscle function, such as muscular dystrophies, aging, and exercise.


Figures

Figure 1
Figure 1
Number of unique SAGE tags detected as a function of the total number of tags cataloged.
Figure 2
Figure 2
Cumulative number of SAGE tags as a function of tag abundance, in decreasing order of abundance.
Figure 3
Figure 3
Relation between abundances of selected transcripts in the CRIBI muscle cDNA library (Lanfranchi et al. 1996; Valle et al. 1997) and abundances of the corresponding SAGE tags in the present study. Transcripts were chosen to represent a wide range of abundances (note logarithmic scale) and were not selected according to degree of similarity between databases. The line of identity is shown.
Figure 4
Figure 4
Map of the NlaIII restriction sites in the mitochondrial genome (HSMITG, GenBank Accession no. X93334), and abundances of the SAGE tags corresponding to each of these sites in a sample of 53,875 total tags (excluding replicate ditags). Mitochondrial DNA is circular, but is shown here as several linear pieces to facilitate presentation. Numbers at end of each segment indicate base number in HSMITG, which corresponds to the base sequence of the RNA encoded by the heavy strand (H strand). Numbers under each arrow indicate the frequency of tags corresponding to the H strand transcripts, which include both rRNAs and 12 of the 13 mRNAs (only NADH6 mRNA is encoded by L strand). Numbers above arrows indicate frequency of L strand transcripts corresponding to each site (if no number is shown, no tags matching that site were detected). The presence of a tag indicates that the transcript was polyadenylated somewhere between that NlaIII site and the next one, or between that NlaIII site and the next tRNA (tRNAs are spliced from primary transcript but not polyadenylated). The tRNA genes and control regions are shaded. Single-letter amino acid abbreviations identify location of specific tRNAs (those encoded by H strand indicated below the shaded area, those encoded by the L strand indicated above the shaded area). The NADH1 tag occurring 21 times (asterisk) matches HUMMTCG (GenBank accession no. J01415) rather than HSMITG (G rather than A at base 2740 of HSMITG). [NADH(n)]NADH dehydrogenase (subunit); [COX(n)]cytochrome c oxidase (subunit); (CYT b) cytochrome b.
Figure 5
Figure 5
Map of the NlaIII restriction sites in some of the most abundant nonmitochondrial cDNAs, and abundances of the SAGE tags corresponding to each of these sites.

Similar articles

Cited by

References

    1. Aloni Y, Attardi G. Symmetrical in vivo transcription of mitochondrial DNA in HeLa cells. Proc Natl Acad Sci. 1971;68:1757–1761. - PMC - PubMed
    1. Anderson S, Bankier AT, Barrell BG, de Bruijn MHL, Coulson AR, Drouin J, Eperon IC, Nierlich DP, Roe BA, Sanger F, Schreier PH, Smith AJH, Staden R, Young IG. Sequence and organization of the human mitochondrial genome. Nature. 1981;290:457–465. - PubMed
    1. Audic S, Claverie J-M. The significance of digital gene expression profiles. Genome Res. 1997;7:986–995. - PubMed
    1. Clayton DA. Transcription of the mammalian mitochondrial genome. Annu Rev Biochem. 1984;53:573–594. - PubMed
    1. Forsberg AM, Nillson E, Wernerman J, Bergstrom J, Hultman E. Muscle composition in relation to age and sex. Clin Sci. 1991;81:249–256. - PubMed

Publication types