

Mouse molecular cytogenetic resource: 157 BACs link the chromosomal and genetic maps
- PMID: 10330132
- PMCID: PMC310771
Mouse molecular cytogenetic resource: 157 BACs link the chromosomal and genetic maps
Abstract
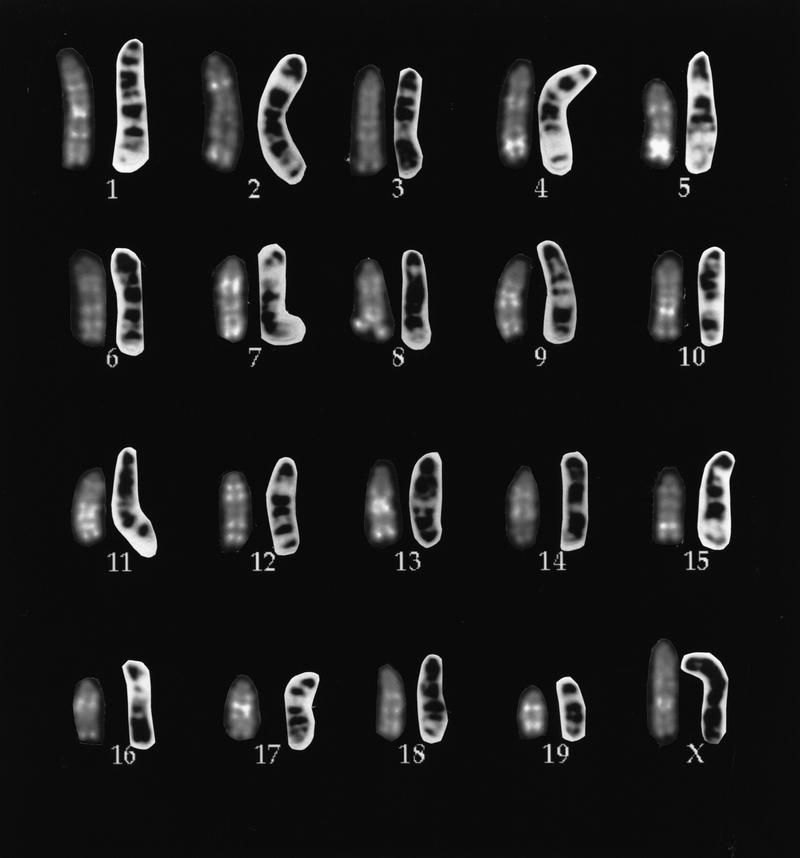
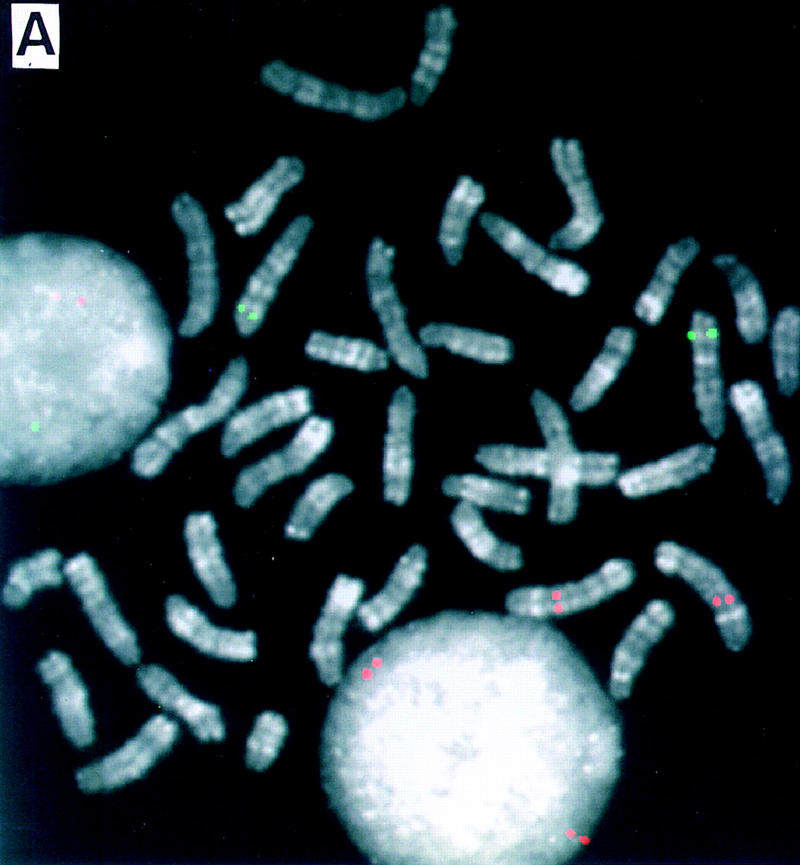
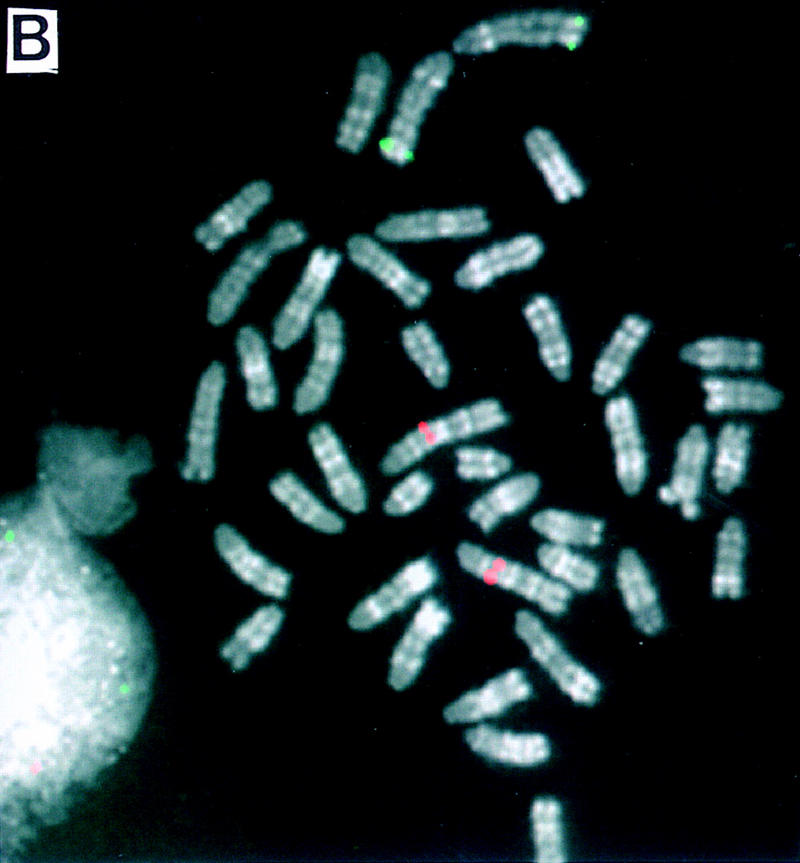
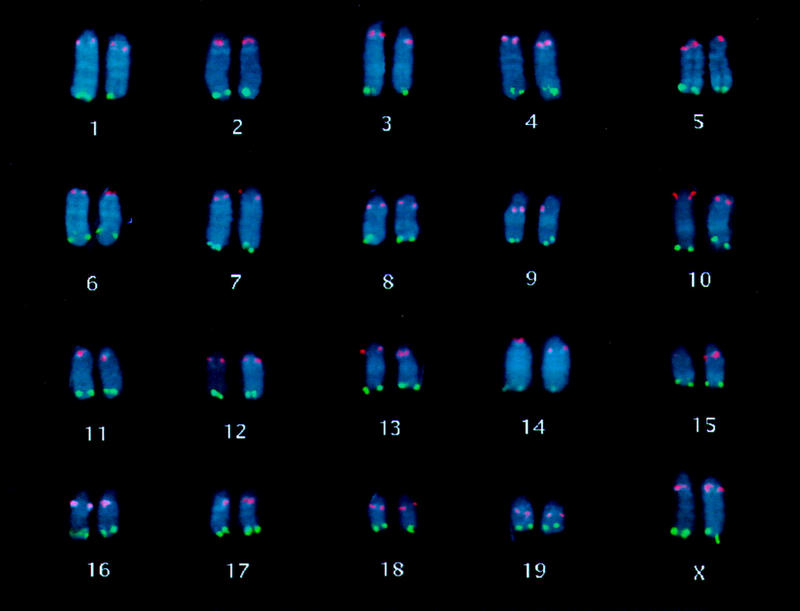
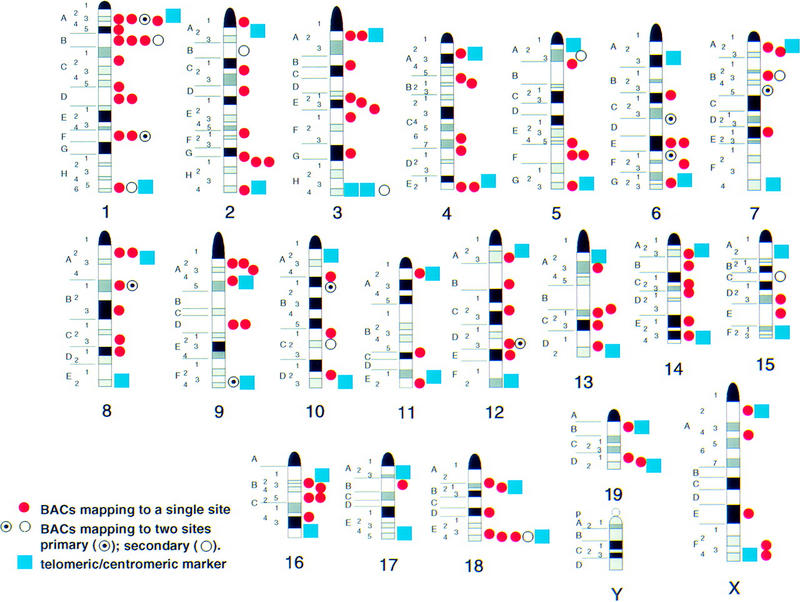
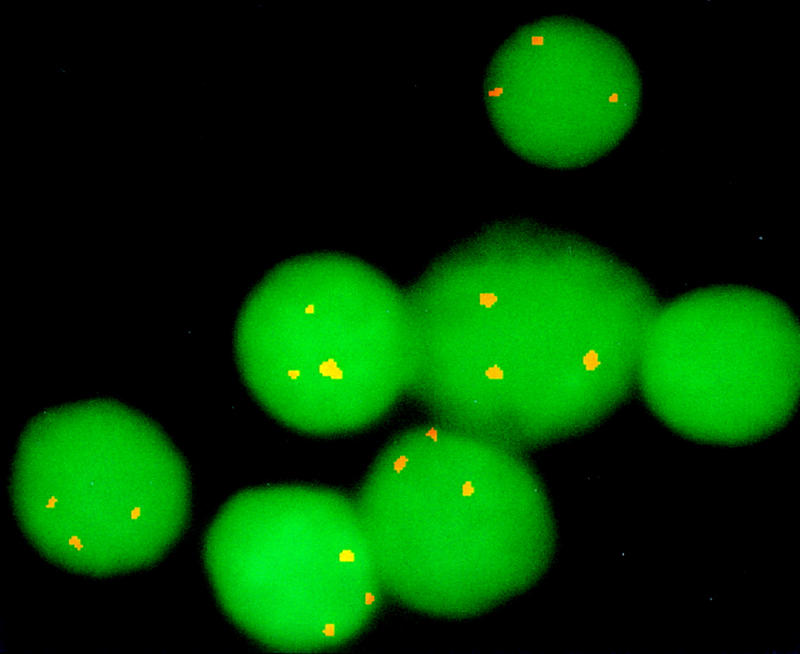
We have established a collection of strong molecular cytogenetic markers that span the mouse autosomes and X chromosome at an average spacing of one per 19 Mb and identify 127 distinct band landmarks. In addition, this Mouse Molecular Cytogenetic Resource relates the ends of the genetic maps to their chromosomal locations. The resource consists of 157 bacterial artificial chromosome (BAC) clones, each of which identifies specific mouse chromosome bands or band borders, and 42 of which are linked to genetic markers that define the centromeric and telomeric ends of the Whitehead/MIT recombinational maps. In addition, 108 randomly selected and 6 STS-linked BACs have been assigned to single chromosome bands. We have also developed a high-resolution fluorescent reverse-banding technique for mouse chromosomes that allows simultaneous localization of probes by fluorescence in situ hybridization (FISH) with respect to the cytogenetic landmarks. This approach integrates studies of the entire mouse genome. Moreover, these reagents will simplify gene mapping and analyses of genomic fragments in fetal and adult mouse models. As shown with the MMU16 telomeric marker for the trisomy 16 mouse model of Down syndrome, these clones can obviate the need for metaphase analyses. The potential contribution of this resource and associated methods extends well beyond mapping and includes clues to understanding mouse chromosomes and their rearrangements in cancers and evolution. Finally it will facilitate the development of an integrated view of the mouse genome by providing anchor points from the genetic to the cytogenetic and functional maps of the mouse as we attempt to understand mutations, their biological consequences, and gene function.
Figures
References
-
- Boyle AL, Feltquite DM, Dracopoli NC, Housman DE, Ward DC. Rapid physical mapping of cloned DNA on banded mouse chromosome by fluorescence in situ hybridization. Genomics. 1992;12:106–115. - PubMed
-
- Breneman JW, Ramsey MJ, Lee DA, Eveleth GG, Minkler JL, Tucker JD. The development of chromosome-specific composite DNA probes for the mouse and their application to chromosome painting. Chromosoma. 1993;102:591–598. - PubMed
-
- DeBry RW, Seldin MF. Human/mouse homology relationships. Genomics. 1996;33:337–351. - PubMed
-
- Dietrich WF, Miller J, Steen R, Merchant M, Damron-Boles D, Husain Z, Dredge R, Daly MJ, Ingalls K, O’Connor TJ, et al. A comprehensive genetic map of the mouse genome. Nature. 1996;380:149–154. - PubMed
Publication types
MeSH terms
Substances
Grants and funding
LinkOut - more resources
Full Text Sources
Molecular Biology Databases
Research Materials
Miscellaneous