. 1999 Jun;19(6):4289-301.
doi: 10.1128/MCB.19.6.4289.

A network of mitogen-activated protein kinases links G protein-coupled receptors to the c-jun promoter: a role for c-Jun NH2-terminal kinase, p38s, and extracellular signal-regulated kinase 5

Affiliations

A network of mitogen-activated protein kinases links G protein-coupled receptors to the c-jun promoter: a role for c-Jun NH2-terminal kinase, p38s, and extracellular signal-regulated kinase 5

M J Marinissen et al. Mol Cell Biol. 1999 Jun.

Abstract

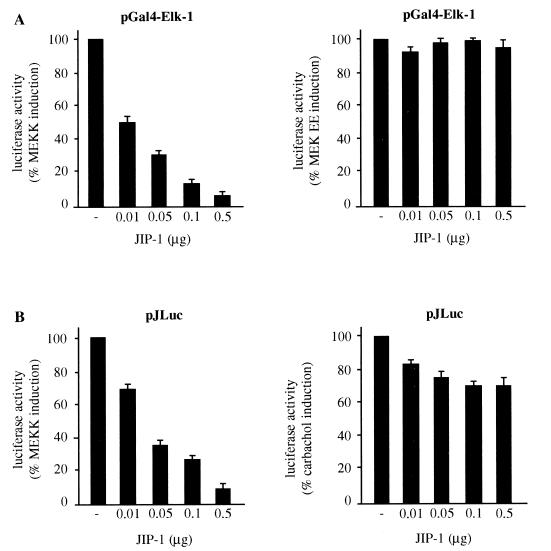
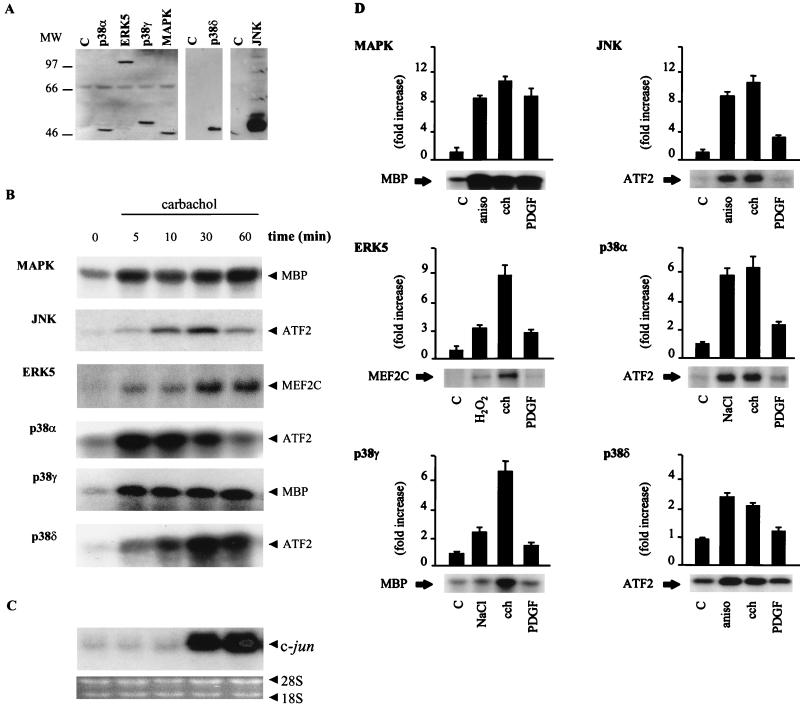
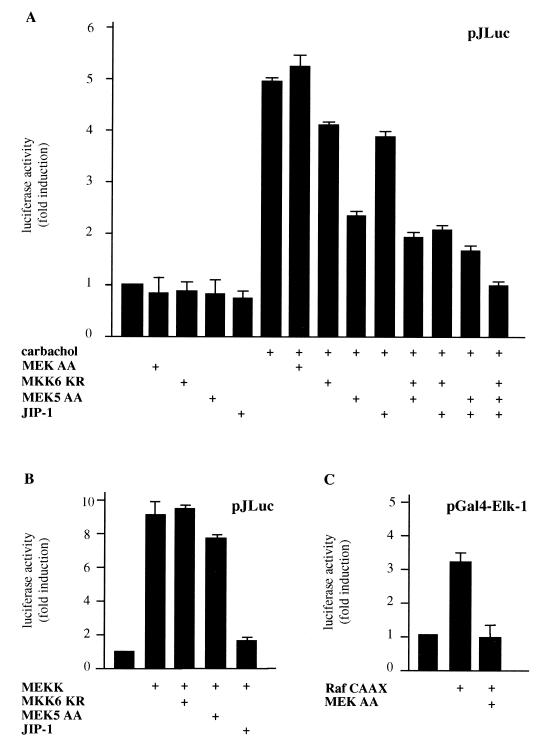
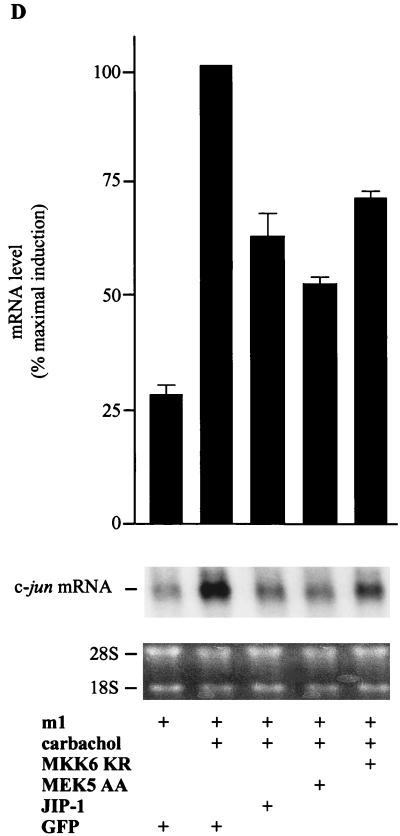
The expression of the c-jun proto-oncogene is rapidly induced in response to mitogens acting on a large variety of cell surface receptors. The resulting functional activity of c-Jun proteins appears to be critical for cell proliferation. Recently, we have shown that a large family of G protein-coupled receptors (GPCRs), represented by the m1 muscarinic receptor, can initiate intracellular signaling cascades that result in the activation of mitogen-activated protein kinases (MAPK) and c-Jun NH2-terminal kinases (JNK) and that the activation of JNK but not of MAPK correlated with a remarkable increase in the expression of c-jun mRNA. Subsequently, however, we obtained evidence that GPCRs can potently stimulate the activity of the c-jun promoter through MEF2 transcription factors, which do not act downstream from JNK. In view of these observations, we set out to investigate further the nature of the signaling pathway linking GPCRs to the c-jun promoter. Utilizing NIH 3T3 cells, we found that GPCRs can activate the c-jun promoter in a JNK-independent manner. Additionally, we demonstrated that these GPCRs can elevate the activity of novel members of the MAPK family, including ERK5, p38alpha, p38gamma, and p38delta, and that the activation of certain kinases acting downstream from MEK5 (ERK5) and MKK6 (p38alpha and p38gamma) is necessary to fully activate the c-jun promoter. Moreover, in addition to JNK, ERK5, p38alpha, and p38gamma were found to stimulate the c-jun promoter by acting on distinct responsive elements. Taken together, these results suggest that the pathway linking GPCRs to the c-jun promoter involves the integration of numerous signals transduced by a highly complex network of MAPK, rather than resulting from the stimulation of a single linear protein kinase cascade. Furthermore, our findings suggest that each signaling pathway affects one or more regulatory elements on the c-jun promoter and that the transcriptional response most likely results from the temporal integration of each of these biochemical routes.


Figures

FIG. 1
FIG. 1
JIP-1 inhibits only partially the stimulation of the c-jun promoter by m1 G protein-coupled receptors in NIH 3T3 cells. (A) NIH 3T3-m1 cells were cotransfected by the calcium phosphate technique with increasing amounts of JIP-1 expression plasmid together with pcDNAIII–Gal4–Elk-1, pGal4-Luc, pcDNAIII–β-gal (1 μg each), and MEKK (0.1 μg) or MEK EE (1 μg). (B) Cells were transfected as described above with pJLuc and pcDNAIII–β-gal and then were either cotransfected with MEKK or exposed for 4 h to 1 mM carbachol. Lysates were collected 48 h later and were assayed for luciferase and β-galactosidase activities. The data represent luciferase activity normalized by the β-galactosidase activity present in each sample and are expressed as percentages of induction with respect to cells transfected without JIP-1. Results are the averages ± standard errors of triplicate samples from a typical experiment. Similar results were obtained in four independent experiments.
FIG. 2
FIG. 2
Activation of novel MAPK family members and c-jun expression by m1 G protein-coupled receptors. (A) NIH 3T3-m1 cells were stably transfected with expression vectors containing HA-tagged MAPK, JNK, ERK5, p38α, p38γ, and p38δ. The gels show expression of HA-tagged kinases in lysates from the control (designated C) and each transfectant by Western blot analysis with a specific anti-HA antibody. MW, molecular weight (in thousands). (B) After serum starvation, cell lines were treated with 1 mM carbachol for 5 to 60 min. Nonstimulated cells were used as controls. After stimulation, lysates were immunoprecipitated with anti-HA antibody and used for kinase reactions as described in Materials and Methods. 32P-labeled substrates are indicated. Autoradiograms correspond to representative experiments for each MAPK family member. Similar results were obtained in three to five independent experiments. (C) Total RNA was extracted from NIH 3T3-m1 cells treated with carbachol for the indicated times. Samples containing 10 μg of RNA were fractionated in agarose gels and analyzed by Northern blotting, as described in Materials and Methods, with 32P-labeled murine c-jun cDNA as a probe. The material present in each lane was judged to be equivalent by ethidium bromide staining of rRNAs. (D) NIH 3T3-m1 cells stably transfected with HA-tagged MAPKs were treated with carbachol (cch), 10 ng of PDGF per ml, 10 μg of anisomycin (aniso) per ml, 500 μM H2O2, or 0.3 M NaCl. Treatments were performed for 5 min for MAPK, p38α, p38γ, and p38δ; 15 min for JNK; and 10 min for ERK5. 32P-labeled substrates are indicated. Autoradiograms correspond to representative experiments for each MAPK family member. Data are the means ± standard errors from three to five independent experiments and are expressed as fold induction with respect to nonstimulated cells (controls). C, control.
FIG. 3
FIG. 3
Kinases downstream from MKK6 and MEK5 mediate the stimulation of the c-jun promoter by carbachol in NIH 3T3 cells expressing m1 G protein-coupled receptors. (A) NIH 3T3-m1 cells were cotransfected by the calcium phosphate technique with pJLuc and pcDNAIII–β-gal reporter plasmid DNAs (1 μg per plate each), along with MEK AA (1 μg), MKK6 KR (1 μg), MEK5 AA (1 μg), or JIP-1 (0.1 μg). Forty-eight hours later, cells were left untreated or exposed for 4 h to 1 mM carbachol. (B) Cells were transfected as described above with MEKK (0.1 μg), pJLuc, pcDNAIII–β-gal, MEK5 AA, MKK6 KR, or JIP-1. (C) Cells were transfected as described above with pGal4–Elk-1, pGal4-Luc, Raf CAAX, and MEK AA (1 μg per plate each). After 48 h, cells were collected and the lysates were assayed for luciferase and β-galactosidase activities. The data represent luciferase activity normalized by the β-galactosidase activity present in each sample, expressed as fold induction relative to the control, and are the averages ± standard errors of triplicate samples from a typical experiment. Similar results were obtained in three independent experiments. (D) NIH 3T3 cells were transfected by the Lipofectamine Plus technique (GIBCO BRL) with pCEFL HA-tagged m1 receptor and GFP, MEK5 AA, MKK6 KR (1 μg per plate each), or JIP-1 (0.1 μg). In all cases, the total transfected DNAs were adjusted to the same amount with empty expression vector. Twenty-four hours after serum starvation, cells were treated with 1 mM carbachol for 30 min and total RNA was extracted as described in Materials and Methods. Samples containing 20 μg of total RNA were fractionated and analyzed by Northern blotting with 32P-labeled murine c-jun cDNA as a probe. The amounts of total RNA present in the lanes were assessed to be equivalent by ethidium bromide staining of rRNAs. Data are the means ± standard errors of replicate samples from two independent experiments and are expressed as percentages of the maximal induction with carbachol. The autoradiogram corresponds to a representative experiment.
FIG. 3
FIG. 3
Kinases downstream from MKK6 and MEK5 mediate the stimulation of the c-jun promoter by carbachol in NIH 3T3 cells expressing m1 G protein-coupled receptors. (A) NIH 3T3-m1 cells were cotransfected by the calcium phosphate technique with pJLuc and pcDNAIII–β-gal reporter plasmid DNAs (1 μg per plate each), along with MEK AA (1 μg), MKK6 KR (1 μg), MEK5 AA (1 μg), or JIP-1 (0.1 μg). Forty-eight hours later, cells were left untreated or exposed for 4 h to 1 mM carbachol. (B) Cells were transfected as described above with MEKK (0.1 μg), pJLuc, pcDNAIII–β-gal, MEK5 AA, MKK6 KR, or JIP-1. (C) Cells were transfected as described above with pGal4–Elk-1, pGal4-Luc, Raf CAAX, and MEK AA (1 μg per plate each). After 48 h, cells were collected and the lysates were assayed for luciferase and β-galactosidase activities. The data represent luciferase activity normalized by the β-galactosidase activity present in each sample, expressed as fold induction relative to the control, and are the averages ± standard errors of triplicate samples from a typical experiment. Similar results were obtained in three independent experiments. (D) NIH 3T3 cells were transfected by the Lipofectamine Plus technique (GIBCO BRL) with pCEFL HA-tagged m1 receptor and GFP, MEK5 AA, MKK6 KR (1 μg per plate each), or JIP-1 (0.1 μg). In all cases, the total transfected DNAs were adjusted to the same amount with empty expression vector. Twenty-four hours after serum starvation, cells were treated with 1 mM carbachol for 30 min and total RNA was extracted as described in Materials and Methods. Samples containing 20 μg of total RNA were fractionated and analyzed by Northern blotting with 32P-labeled murine c-jun cDNA as a probe. The amounts of total RNA present in the lanes were assessed to be equivalent by ethidium bromide staining of rRNAs. Data are the means ± standard errors of replicate samples from two independent experiments and are expressed as percentages of the maximal induction with carbachol. The autoradiogram corresponds to a representative experiment.
FIG. 4
FIG. 4
Stimulation of the c-jun promoter activity by novel members of the MAPK family. (A) NIH 3T3-m1 cells were cotransfected with pJLuc and pcDNAIII–β-gal (1 μg per plate each) plasmid DNAs by the calcium phosphate technique. Expression vectors for MAPK, JNK, ERK5, p38α, p38γ, and p38δ (1 μg each), alone or in combination with their upstream activating kinases MEK EE (1 μg), MEKK (0.1 μg), MEK5 DD (1 μg), and MKK6 (1 μg), were included in the transfection mixtures. (B) Cells were transfected as described above with MKK6 and p38δ, alone or in combination with pcDNAIII-Gal4-ATF2, pGal4-Luc, and pcDNAIII–β-gal (1 μg each). Forty-eight hours after transfection, cells were collected and the lysates were assayed for luciferase and β-galactosidase activities. The data represent luciferase activity normalized by the β-galactosidase activity present in each sample, expressed as fold induction relative to the control. Values are the averages ± standard errors of triplicate samples from a typical experiment. Nearly identical results were obtained in three additional experiments.
FIG. 5
FIG. 5
Distinct regulatory elements mediate the activation of the c-jun promoter by MAPK family members. (A) Schematic representation of the murine c-jun promoter. (B) NIH 3T3-m1 cells were cotransfected with the reporter plasmid pcDNAIII–β-gal together with pJC6, pJTX, pJSX, or pJSTX (1 μg per plate). Crosses indicate the sites of point mutations in the AP-1-like (pJTX) and the MEF2 (pJSX) binding sites. The plasmid pJSTX contains mutations for both the AP-1-like and MEF2 sites. JNK plus MEKK, MEK5 plus ERK5, MKK6 plus p38α, and MKK6 plus p38γ (1 μg per plate each) were included in the transfection mixtures. Forty-eight hours later, cells were collected and the lysates were assayed for CAT and β-galactosidase activities. The data represent CAT activity normalized by the β-galactosidase activity present in each sample, expressed as the percentages of the pJC6 induction elicited by each kinase, and are the averages ± standard errors of triplicate samples from a typical experiment. Similar results were obtained in three independent experiments.
FIG. 6
FIG. 6
Expression of MEF2A, -B, -C, and -D mRNAs in NIH 3T3 and NIH 3T3-m1 cells. Samples containing 20 μg of total RNA per lane, extracted from NIH 3T3 and NIH 3T3-m1 cells, were fractionated and analyzed by Northern blotting with 32P-labeled DNA fragments that were unique for each MEF2 as probes, as described in Materials and Methods. Ten micrograms of total RNA from human and mouse hearts and brains was used for positive controls. The arrows on the left indicate the detected mRNAs species. rRNA positions are indicated on the right. Ethidium bromide staining of the rRNAs shows the amounts of RNA present in each lane.
FIG. 7
FIG. 7
Differential in vitro phosphorylation of bacterially expressed GST-MEF2A, -MEF2B, -MEF2C, and -MEF2D fusion proteins by MAPK family members. (A) 293T cells were transfected with expression vectors containing GPF or HA-tagged MAPK, JNK, ERK5, p38α, p38γ, and p38δ and the upstream activating kinases. After serum starvation, cellular lysates were immunoprecipitated with anti-HA antibody and were used for in vitro kinase assays as described in Materials and Methods. The transactivation domains of MEF2A (aa 151 to 411), -B (aa 161 to 350), -C (aa 87 to 467), and -D (aa 160 to 515), expressed as GST fusion proteins, were used as substrates. 32P-labeled products are indicated. Autoradiograms are representative of three independent experiments. C, control.
FIG. 8
FIG. 8
Effect of MAPK family members on MEF2 transactivating activity. (A) The expression of Gal4 fusion proteins containing the transactivation domains of MEF2A (aa 151 to 411), -B (aa 161 to 350), -C (aa 87 to 467), and -D (aa 160 to 515) in extracts of transfected cells was determined by Western blotting with anti-Gal4 monoclonal antibody as described in Materials and Methods. MW, molecular weight (in thousands). (B) NIH 3T3-m1 cells were cotransfected with the pDNAIII-Gal4-MEF2 chimeric molecules (0.5 μg), as described above, along with pGal4-Luc and pcDNAIII–β-gal plasmid DNAs (1 μg per plate each) by the calcium phosphate technique. Expression vectors for MAPK, JNK, ERK5, p38α, p38γ, and p38δ (1 μg each), in combination with their upstream activating kinases MEK EE (1 μg), MEKK (0.1 μg), MEK5 DD (1 μg), and MKK6 (1 μg), were included in the transfection mixtures. Forty-eight hours after transfection, cells were collected and the lysates were assayed for luciferase and β-galactosidase activities. The data represent luciferase activity normalized by the β-galactosidase activity present in each sample, expressed as fold induction relative to the control. Values are the averages ± standard errors of triplicate samples from a typical experiment. Nearly identical results were obtained in three additional experiments.
FIG. 9
FIG. 9
Relationship between MAPKs and the activation of MEF2 proteins by m1 receptors. The transcriptional activity of MEF2A and MEF2C is increased by carbachol in NIH 3T3 cells expressing m1 G protein-coupled receptors. (A) NIH 3T3-m1 cells were cotransfected by the calcium phosphate technique with pDNAIII-Gal4-MEF2A (aa 151 to 411), -MEF2B (aa 161 to 350), -MEF2C (aa 171 to 328), and -MEF2D (aa 160 to 515) as well as with pGal4-Luc and pcDNAIII–β-gal reporter plasmid DNAs (1 μg per plate). Twenty-four hours later, cells were left untreated (control) (−) or exposed for 20 h to 1 mM carbachol (+) and were assayed for luciferase and β-galactosidase activities. The data represent luciferase activity normalized by the β-galactosidase activity present in each sample, expressed as fold induction relative to the control. Values are the averages ± standard errors of triplicate samples from a typical experiment. Similar results were obtained in three additional experiments. (B) Cells were transfected with pGal4-MEF2A and pGal4-MEF2C, along with JIP-1 (0.1 μg), MEK5 AA (1 μg), or MKK6 KR (1 μg), and were exposed to carbachol as described above. Lysates were collected and assayed for luciferase and β-galactosidase activities. The data represent luciferase activity normalized by the β-galactosidase activity present in each sample, expressed as percentages of induction with respect to control cells exposed to carbachol. Results are the averages ± standard errors of triplicate samples from a representative experiment. Similar results were obtained in two independent experiments.
FIG. 10
FIG. 10
Proposed model for m1 G protein-coupled receptor signaling to the c-jun promoter. MAPK family members are activated by heterotrimeric G protein upon m1 receptor stimulation. Activated JNK, ERK5, p38α, and p38γ transduce signals that converge in the nucleus to control the activity of transcription factors bound to the AP-1-like and MEF2 regulatory elements within the c-jun promoter. Known intermediate molecules and pathways are depicted, and they are described in the text. The unknown molecules are indicated by question marks.

References

    1. Angel P, Hattori K, Smeal T, Karin M. The jun proto-oncogene is positively autoregulated by its product, Jun/AP-1. Cell. 1988;55:875–885. - PubMed
    1. Angel P, Karin M. The role of Jun, Fos and the AP-1 complex in cell-proliferation and transformation. Biochim Biophys Acta. 1991;1072:129–157. - PubMed
    1. Ball A R, Jr, Bos T J, Loliger C, Nagata L P, Nishimura T, Su H, Tsuchie H, Vogt P K. Jun: oncogene and transcriptional regulator. Cold Spring Harbor Symp Quant Biol. 1988;53:687–693. - PubMed
    1. Benbrook D M, Jones N C. Heterodimer formation between CREB and JUN proteins. Oncogene. 1990;5:295–302. - PubMed
    1. Braun T, Tannich E, Buschhausen-Denker G, Arnold H-H. Promoter upstream elements of the chicken cardiac myosin light-chain 2-A gene interact with trans-acting regulatory factors for muscle-specific transcription. Mol Cell Biol. 1989;9:2513–2525. - PMC - PubMed

MeSH terms