. 1999 May 17;145(4):699-711.
doi: 10.1083/jcb.145.4.699.

Overexpression of protein kinase C betaII induces colonic hyperproliferation and increased sensitivity to colon carcinogenesis

Affiliations

Overexpression of protein kinase C betaII induces colonic hyperproliferation and increased sensitivity to colon carcinogenesis

N R Murray et al. J Cell Biol. .

Abstract

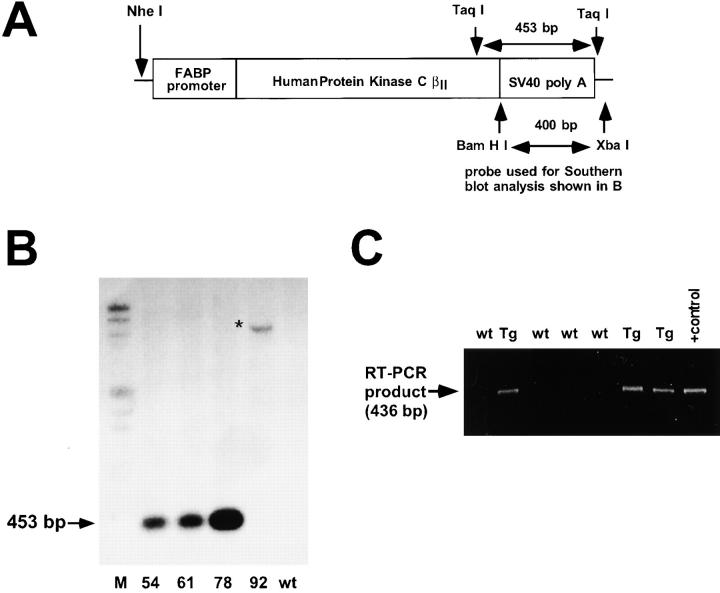
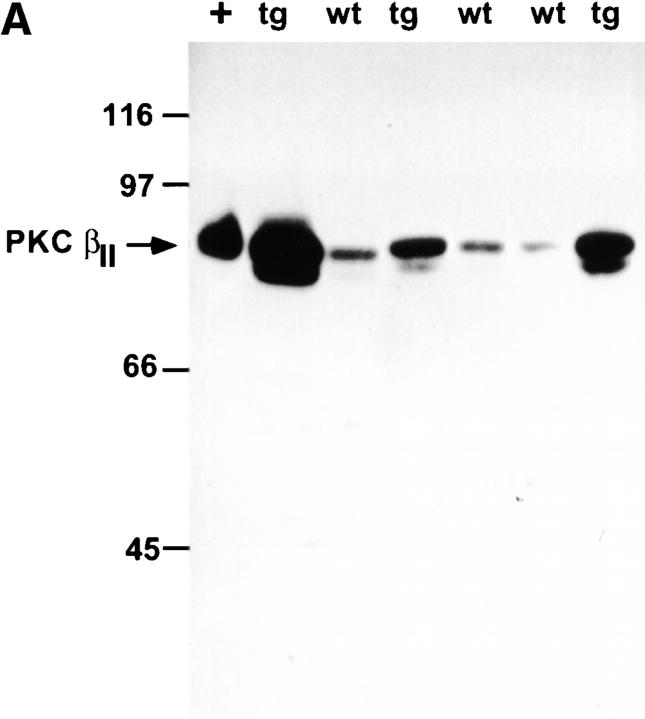
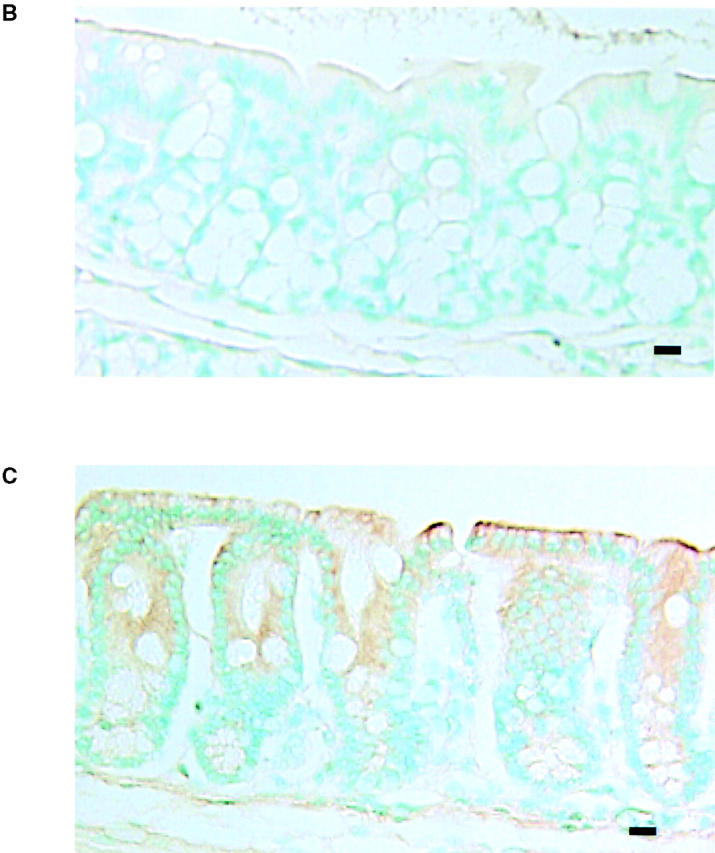
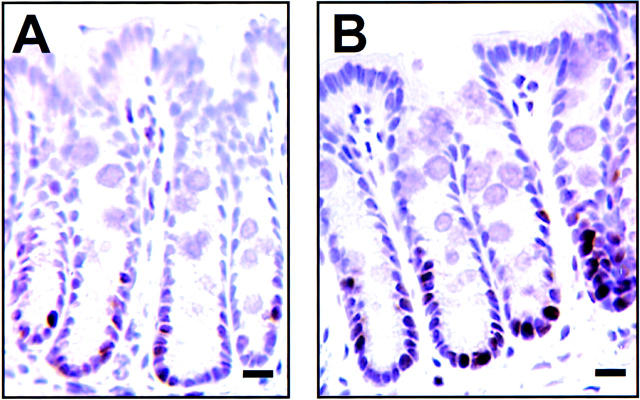
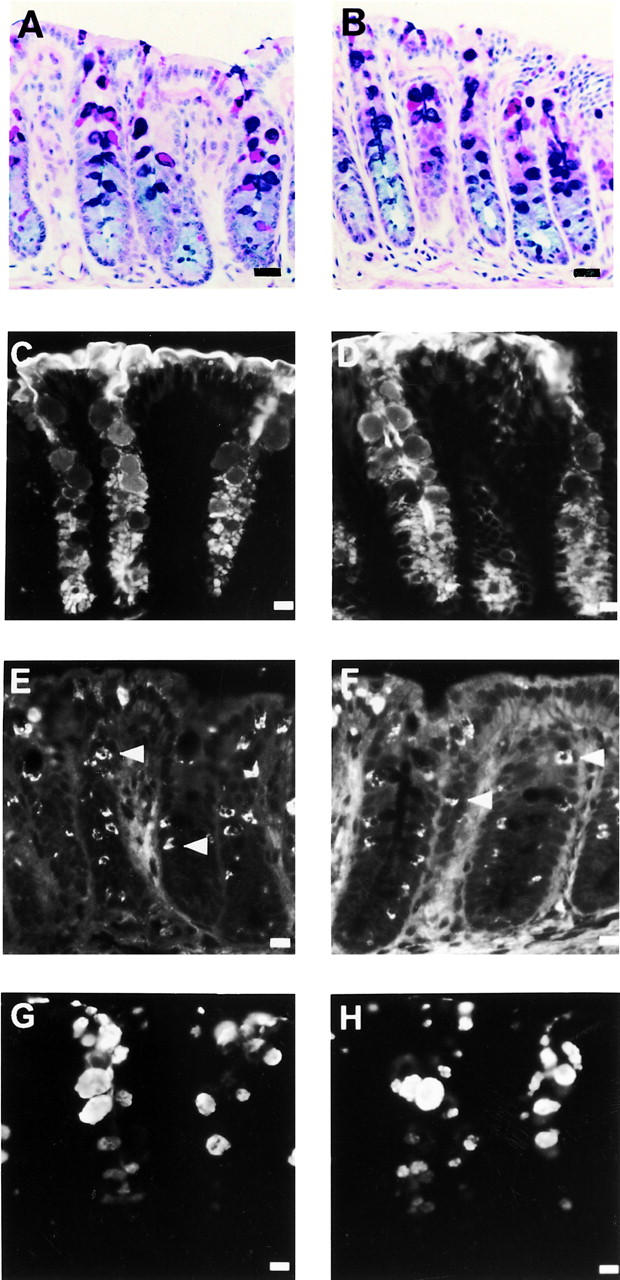
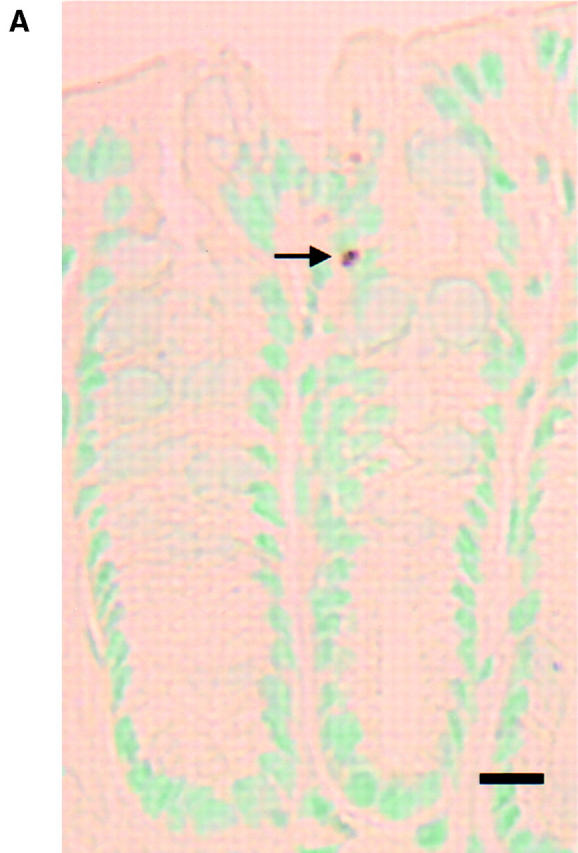
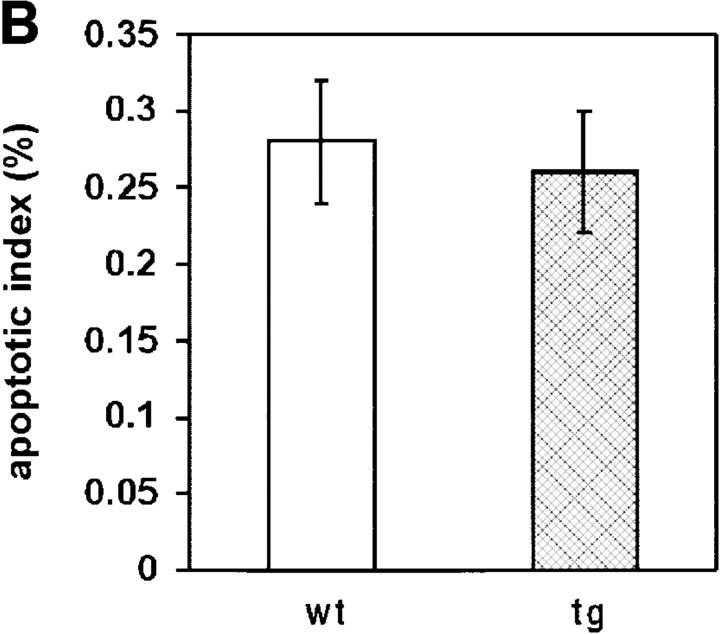
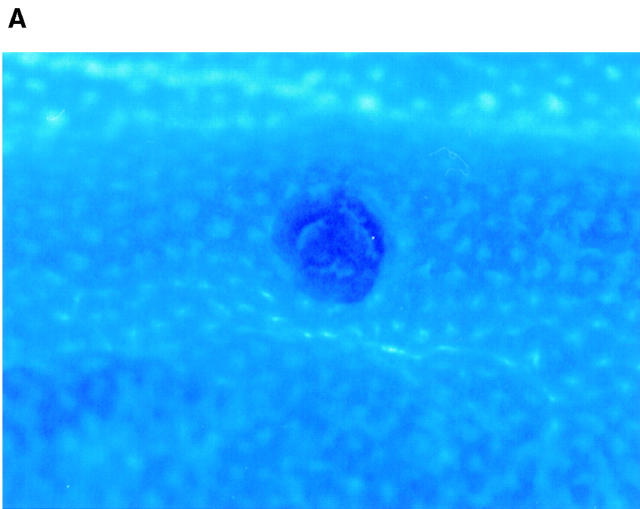
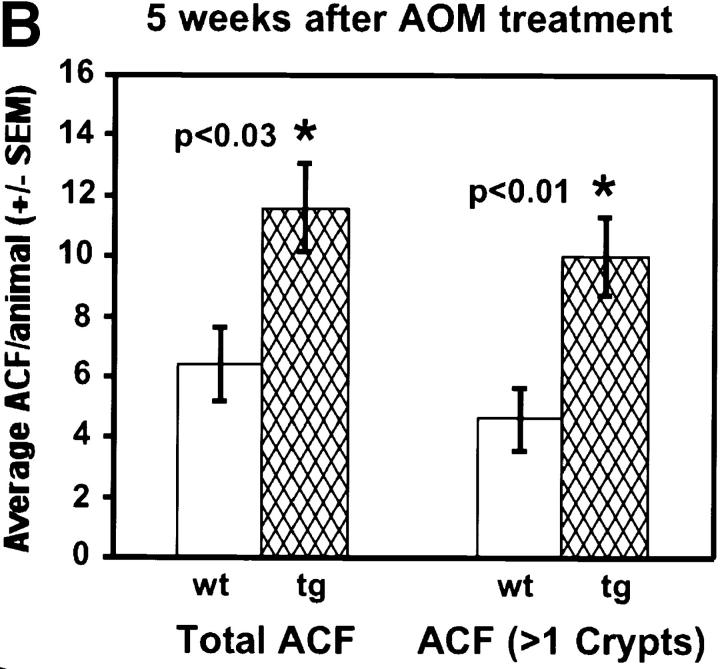
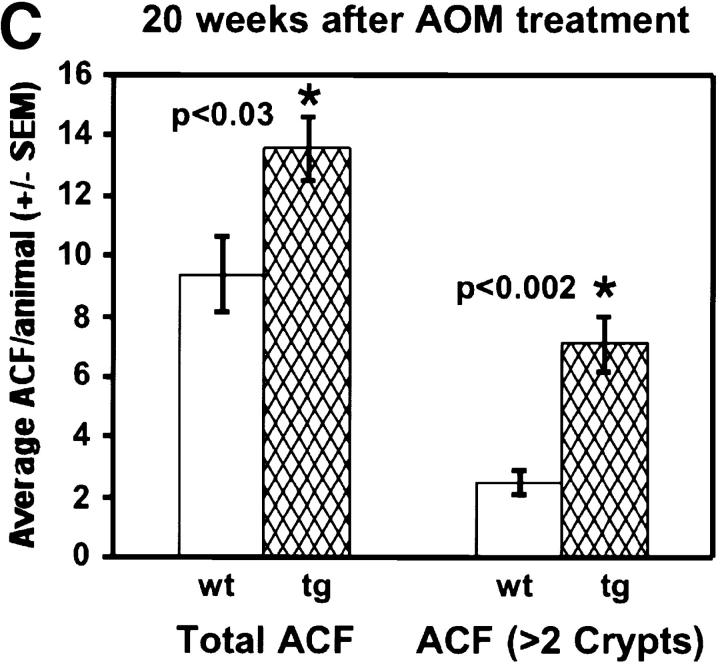
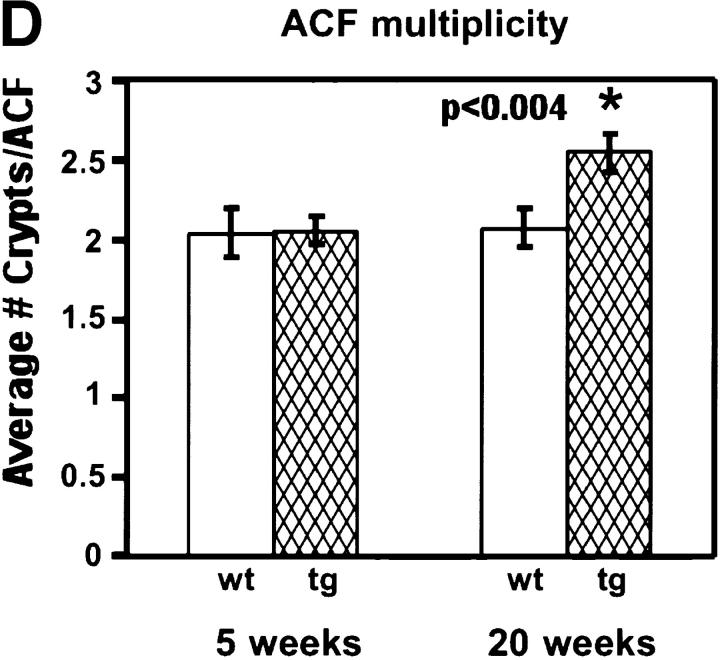
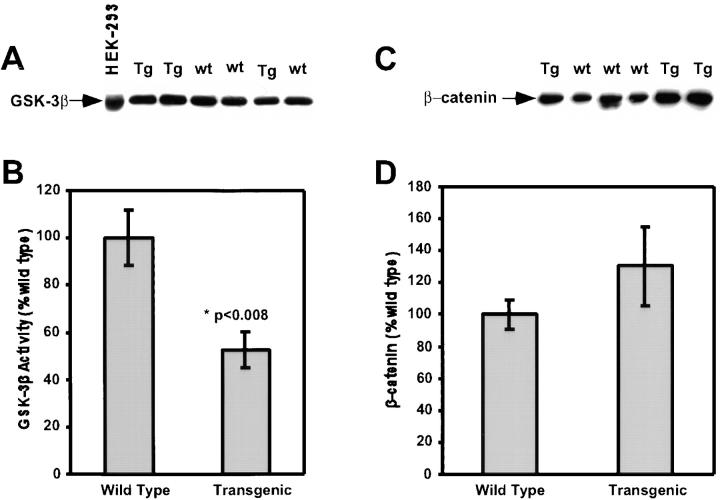
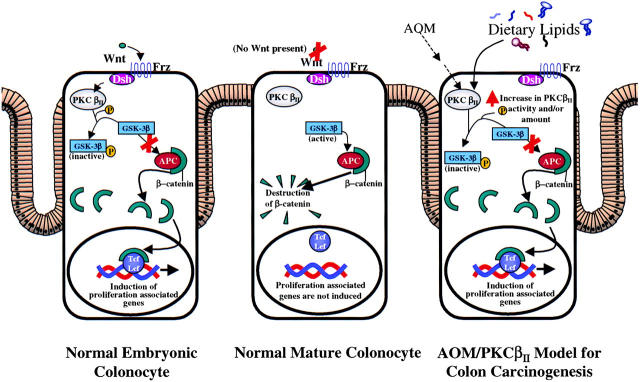
Protein kinase C betaII (PKC betaII) has been implicated in proliferation of the intestinal epithelium. To investigate PKC betaII function in vivo, we generated transgenic mice that overexpress PKC betaII in the intestinal epithelium. Transgenic PKC betaII mice exhibit hyperproliferation of the colonic epithelium and an increased susceptibility to azoxymethane-induced aberrant crypt foci, preneoplastic lesions in the colon. Furthermore, transgenic PKC betaII mice exhibit elevated colonic beta-catenin levels and decreased glycogen synthase kinase 3beta activity, indicating that PKC betaII stimulates the Wnt/adenomatous polyposis coli (APC)/beta-catenin proliferative signaling pathway in vivo. These data demonstrate a direct role for PKC betaII in colonic epithelial cell proliferation and colon carcinogenesis, possibly through activation of the APC/beta-catenin signaling pathway.


Figures

Figure 1
Figure 1
(A) Generation and characterization of transgenic PKC βII mice. Schematic diagram of the PKC βII transgene construct. A transgene construct consisting of the rat liver FABP promoter (−596 to +21), full-length human PKC βII cDNA, and the SV40 large T antigen polyadenylation signal sequence was generated. Restriction sites for excision of the construct from the cloning vector (NheI/ XbaI), for generation of radiolabeled probe (BamHI/XbaI), and for digestion of genomic DNA for Southern blot analysis (Taq I) are indicated with arrows. (B) Southern blot analysis to identify founder transgenic mice. Tail DNA was digested with Taq I to generate a 453-bp fragment containing the SV40 polyadenylation sequence from the transgene (see A). 5 μg of digested genomic DNA was resolved by gel electrophoresis and transferred to nitrocellulose, and the membrane was incubated with 32P-labeled probe to the SV40 polyadenylation sequence. M, radiolabeled DNA mol wt markers; 54, 61, 78, and 92 indicate genomic DNA from four founder animals carrying the transgene construct; wt, genomic DNA from a nontransgenic mouse; * indicates an anomalous size band reacting with the transgene probe. (C) Transgenic PKC βII RNA is expressed in the colon of transgenic mice. Total RNA was isolated from scraped colonic epithelium from a litter of mice in the 54 transgenic line. Reverse transcription and amplification was carried out using primers specific to regions of sequence divergence between human and mouse PKC βII. Amplification products were separated on agarose gels and the product was visualized by ethidium bromide staining. Human brain RNA was used as a positive control (+ control); tg, RNA from transgenic animals; wt, RNA from nontransgenic animals. Genotype was confirmed by slot blot analysis.
Figure 2
Figure 2
PKC βII protein is overexpressed in the colons of transgenic mice. (A) Immunoblot analysis for PKC βII. A litter of mice from the 54 transgenic line was killed, the colons were isolated and scraped, and total cell lysates (30 μg) were subjected to immunoblot analysis using a PKC βII–specific antibody as previously described (Murray et al., 1993). Densitometric analysis indicates that transgenic animals express an average of fivefold higher level of PKC βII than do nontransgenic littermates. tg, lysates from transgenic animals; wt, lysates from nontransgenic animals; +, rat brain extract used as positive control. (B and C) Immunohistochemical localization of PKC βII in proximal colon of transgenic mice. Proximal colon from transgenic mice and nontransgenic littermates in the 54 transgenic line were fixed in 70% ethanol, embedded in paraffin, sectioned, and immunostained for PKC βII as described in Materials and Methods. In nontransgenic colon (B), endogenous PKC βII localizes to the mid-crypt areas and to the luminal surface of the crypts. In transgenic colon (C), PKC βII staining is greater than in the nontransgenic animal and is observed along the entire crypt axis. Original magnification: ×400. Bars, 10 μm.
Figure 2
Figure 2
PKC βII protein is overexpressed in the colons of transgenic mice. (A) Immunoblot analysis for PKC βII. A litter of mice from the 54 transgenic line was killed, the colons were isolated and scraped, and total cell lysates (30 μg) were subjected to immunoblot analysis using a PKC βII–specific antibody as previously described (Murray et al., 1993). Densitometric analysis indicates that transgenic animals express an average of fivefold higher level of PKC βII than do nontransgenic littermates. tg, lysates from transgenic animals; wt, lysates from nontransgenic animals; +, rat brain extract used as positive control. (B and C) Immunohistochemical localization of PKC βII in proximal colon of transgenic mice. Proximal colon from transgenic mice and nontransgenic littermates in the 54 transgenic line were fixed in 70% ethanol, embedded in paraffin, sectioned, and immunostained for PKC βII as described in Materials and Methods. In nontransgenic colon (B), endogenous PKC βII localizes to the mid-crypt areas and to the luminal surface of the crypts. In transgenic colon (C), PKC βII staining is greater than in the nontransgenic animal and is observed along the entire crypt axis. Original magnification: ×400. Bars, 10 μm.
Figure 3
Figure 3
Transgenic PKC βII mice exhibit increased proliferation of the colonic epithelium. 12-wk-old transgenic and nontransgenic mice were killed and their colons were isolated and fixed in paraformaldehyde as previously described (Chang et al., 1997). Sections were stained for PCNA with DAB (brown) using the ABC staining system (Santa Cruz Biotechnology). Sections were counterstained with hematoxylin (blue). A shows the nontransgenic mouse colon, and B shows the transgenic mouse colon. Original magnification: ×400. Bars, 10 μm.
Figure 4
Figure 4
Transgenic PKC βII mice show no change in colonic epithelial cell differentiation. (A and B) Alcian blue/PAS staining. Mucin-containing goblet cells in colonic epithelium of nontransgenic (A) and transgenic PKC βII (B) mice were stained with Alcian blue/PAS. (C–H) Lectin staining. Sections from nontransgenic (C, E, and G) and transgenic (D, F, and H) mouse colonic epithelium were incubated with three different biotinylated lectins and detected with avidin-conjugated rhodamine red-X. C and D, DBA; E and F, PNA; G and H, UEAI. Arrowheads indicate Golgi staining in PNA-stained sections. Bars, 10 μm.
Figure 5
Figure 5
Transgenic PKC βII mice exhibit no change in apoptosis. (A) Detection of apoptosis in the colonic epithelium by in situ TUNEL. Distal colonic epithelium was isolated and fixed in paraformaldehyde as previously described (Chang et al., 1997) and cells undergoing apoptosis were detected by an in situ TUNEL method. A representative apoptotic cell is indicated by the arrow. (B) Quantitative analysis of in situ TUNEL staining. 100 crypts from transgenic and nontransgenic mice were scored for apoptotic cells and the apoptotic index was calculated (percentage of apoptotic cells). Results are expressed as the mean ± SEM. Bar, 10 μm.
Figure 5
Figure 5
Transgenic PKC βII mice exhibit no change in apoptosis. (A) Detection of apoptosis in the colonic epithelium by in situ TUNEL. Distal colonic epithelium was isolated and fixed in paraformaldehyde as previously described (Chang et al., 1997) and cells undergoing apoptosis were detected by an in situ TUNEL method. A representative apoptotic cell is indicated by the arrow. (B) Quantitative analysis of in situ TUNEL staining. 100 crypts from transgenic and nontransgenic mice were scored for apoptotic cells and the apoptotic index was calculated (percentage of apoptotic cells). Results are expressed as the mean ± SEM. Bar, 10 μm.
Figure 6
Figure 6
Transgenic PKC βII mice are more susceptible to AOM-induced ACF formation. (A) An ACF from an AOM-treated mouse. Colons from AOM-treated mice were cut longitudinally from cecum to anus, fixed flat in 70% ethanol, and stained with 0.2% methylene blue for 5 min. Colons were scored for ACF under low magnification (×40) using previously defined criteria for ACF (Bird, 1987; McLellan and Bird, 1988). A representative ACF from an AOM-treated animal is shown. This ACF involves three adjacent crypts. Bar, 100 μm. (B–D) Transgenic PKC βII mice have increased levels of AOM-induced ACF. 6-wk-old female mice from the 54 line (transgenic and nontransgenic littermates) were injected with AOM (10 mg/kg body wt) weekly for 2 wk. At 5 and 20 wk after the second injection the mice were killed and the colons were analyzed for the presence of ACF as described in panel A. wt, nontransgenic; tg, transgenic. (B) ACF analysis at 5 wk after treatment. Total ACF per animal and ACF involving >1 crypt were plotted for both transgenic and nontransgenic animals. For each group of animals, n = 5. (C) ACF analysis at 20 wk after treatment. Total ACF per animal and ACF involving >2 crypt were plotted for both transgenic and nontransgenic animals. For each group of animals, n = 5. (D) Crypt multiplicity of ACF at 5 and 20 wk. The average crypt multiplicity for ACF in nontransgenic and transgenic mice was calculated at 5 and 20 wk. For each group of animals, n = 5. Error bars represent the SEM.
Figure 6
Figure 6
Transgenic PKC βII mice are more susceptible to AOM-induced ACF formation. (A) An ACF from an AOM-treated mouse. Colons from AOM-treated mice were cut longitudinally from cecum to anus, fixed flat in 70% ethanol, and stained with 0.2% methylene blue for 5 min. Colons were scored for ACF under low magnification (×40) using previously defined criteria for ACF (Bird, 1987; McLellan and Bird, 1988). A representative ACF from an AOM-treated animal is shown. This ACF involves three adjacent crypts. Bar, 100 μm. (B–D) Transgenic PKC βII mice have increased levels of AOM-induced ACF. 6-wk-old female mice from the 54 line (transgenic and nontransgenic littermates) were injected with AOM (10 mg/kg body wt) weekly for 2 wk. At 5 and 20 wk after the second injection the mice were killed and the colons were analyzed for the presence of ACF as described in panel A. wt, nontransgenic; tg, transgenic. (B) ACF analysis at 5 wk after treatment. Total ACF per animal and ACF involving >1 crypt were plotted for both transgenic and nontransgenic animals. For each group of animals, n = 5. (C) ACF analysis at 20 wk after treatment. Total ACF per animal and ACF involving >2 crypt were plotted for both transgenic and nontransgenic animals. For each group of animals, n = 5. (D) Crypt multiplicity of ACF at 5 and 20 wk. The average crypt multiplicity for ACF in nontransgenic and transgenic mice was calculated at 5 and 20 wk. For each group of animals, n = 5. Error bars represent the SEM.
Figure 7
Figure 7
Transgenic PKC βII mice exhibit decreased GSK-3β activity and increased β-catenin levels. (A) Immunoblot analysis for GSK-3β in the colonic epithelium of transgenic (tg) and nontransgenic (wt) mice. (B) Immunoprecipitation kinase assays for GSK-3β were performed on scraped colon extracts from transgenic and nontransgenic mice. Results were normalized to GSK-3β activity in nontransgenic animals. Error bars represent the SEM. (C) Representative immunoblot analysis for β-catenin in the colonic epithelium of transgenic and nontransgenic mice. (D) Densitometric analysis of β-catenin expression. Results were normalized to β-catenin in wild-type mice. n = 6 for each group. Error bars represent SEM. Equal amounts of total protein were analyzed in each immunoblot.
Figure 8
Figure 8
Model of a proposed functional role for PKC βII in colon carcinogenesis. PKC βII is proposed to function in the Wnt signaling pathway in the colonic epithelium. (A) During embryogenesis, Wnt signals through Dsh to PKC βII, which phosphorylates GSK-3β to inhibit its activity. β-catenin levels rise, leading to Tcf-dependent activation of transcription of growth-related genes. (B) In the adult colonocyte, Wnt is not present, GSK-3β activity is constitutively high, and APC binds β-catenin and targets it for degradation. (C) In transgenic PKC βII mice, PKC βII levels and activity are elevated. PKC βII can induce phosphorylation and inactivation of GSK-3β. β-catenin levels rise and Tcf-dependent transcription of growth-related genes is induced, leading to increased proliferation. Similarly, AOM treatment leads to increased expression of PKC βII stimulating this proliferative pathway during colon carcinogenesis. Biochemical evidence suggests that PKC βII can be activated by various lipid components of a cancer-promotive diet, including free fatty acids, secondary bile acids, and bacterially-derived DAG. Direct stimulation of PKC βII by these factors leads to Wnt-independent activation of the APC/β-catenin signaling pathway, hyperproliferation, and enhanced susceptibility to colon carcinogenesis.

Similar articles

Cited by

References

    1. Bertagnolli MM, McDougall CJ, Newmark HL. Colon cancer prevention: intervening in a multistage process. Proc Soc Exp Biol Med. 1997;216:266–274. - PubMed
    1. Bird RP. Observation and quantification of aberrant crypts in the murine colon treated with a colon carcinogen: preliminary findings. Cancer Lett. 1987;37:147–151. - PubMed
    1. Bird RP. Role of aberrant crypt foci in understanding the pathogenesis of colon cancer. Cancer Lett. 1995;93:55–71. - PubMed
    1. Boland CR, Ahnen DJ. Binding of lectins to goblet cell mucin in malignant and premalignant colonic epithelium in the CF-1 mouse. Gastroenterology. 1995;89:127–137. - PubMed
    1. Caldero J, Campo E, Vinas J, Cardesa A. Lectin-binding sites in neoplastic and non-neoplastic colonic mucosa of 1,2-dimethylhydrazine-treated rats. Lab Invest. 1989;61:670–676. - PubMed

Publication types

MeSH terms