. 1999 May 17;145(4):795-808.
doi: 10.1083/jcb.145.4.795.

Mitochondria exert a negative feedback on the propagation of intracellular Ca2+ waves in rat cortical astrocytes

Affiliations

Mitochondria exert a negative feedback on the propagation of intracellular Ca2+ waves in rat cortical astrocytes

E Boitier et al. J Cell Biol. .

Abstract

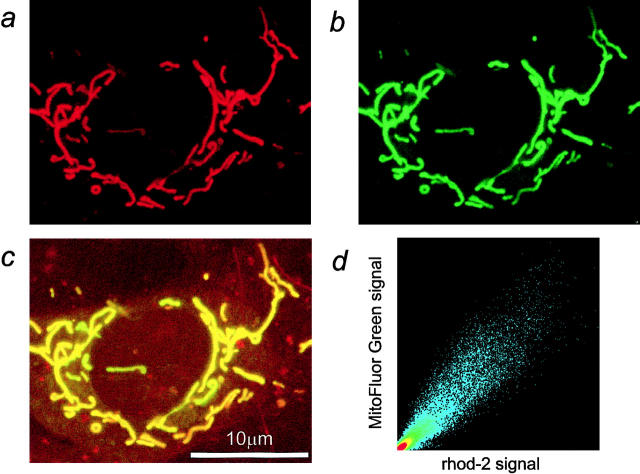
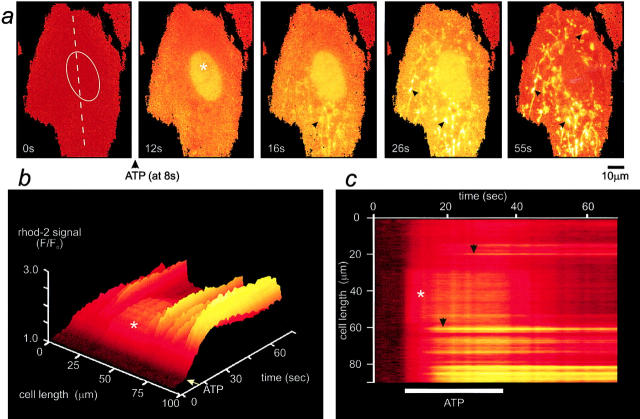
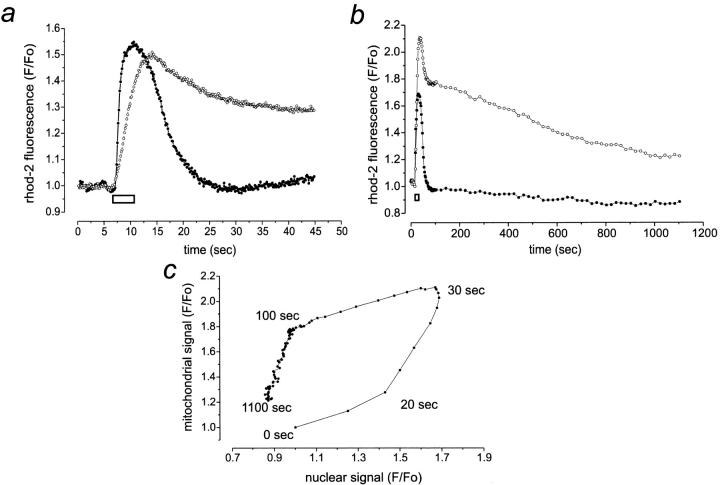
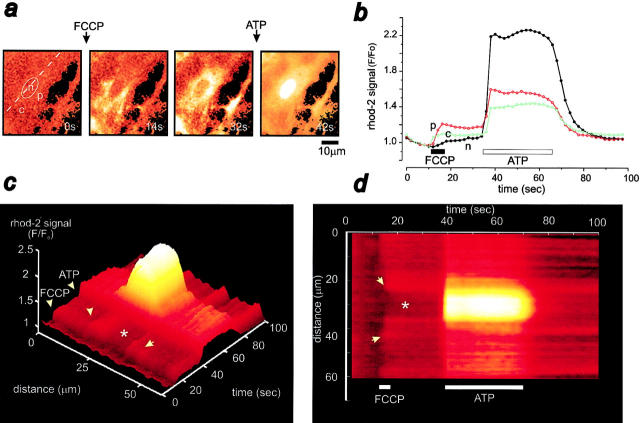
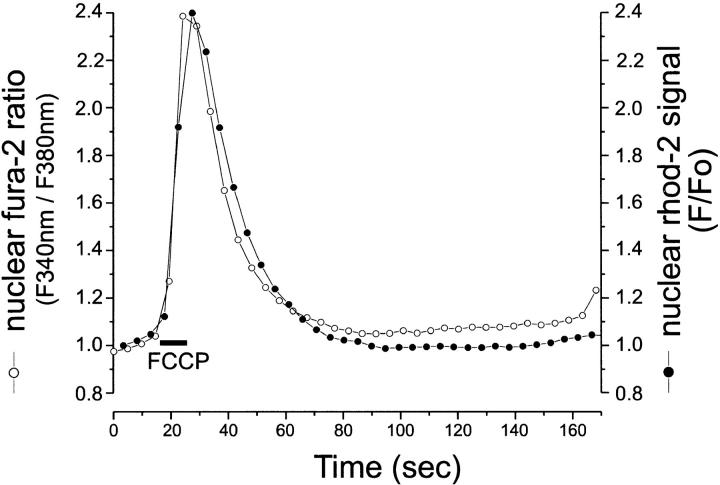
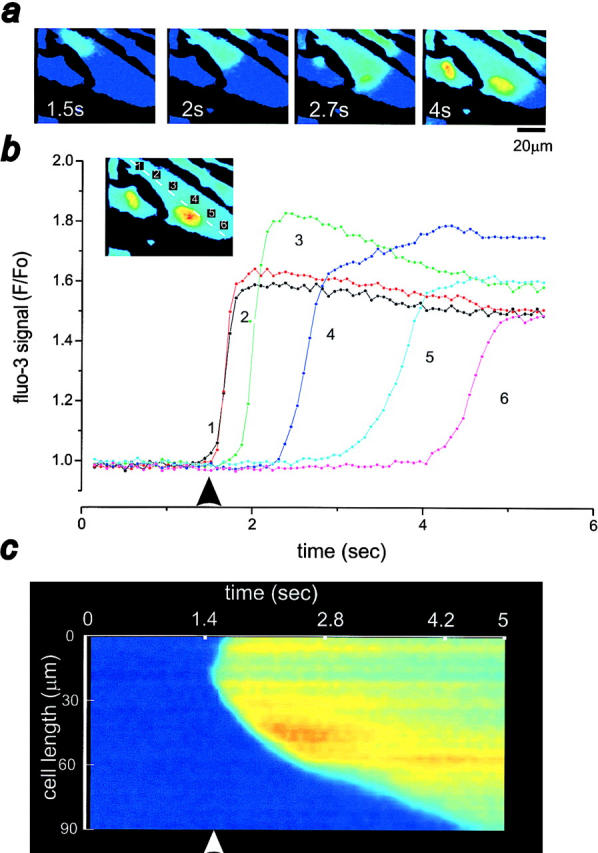
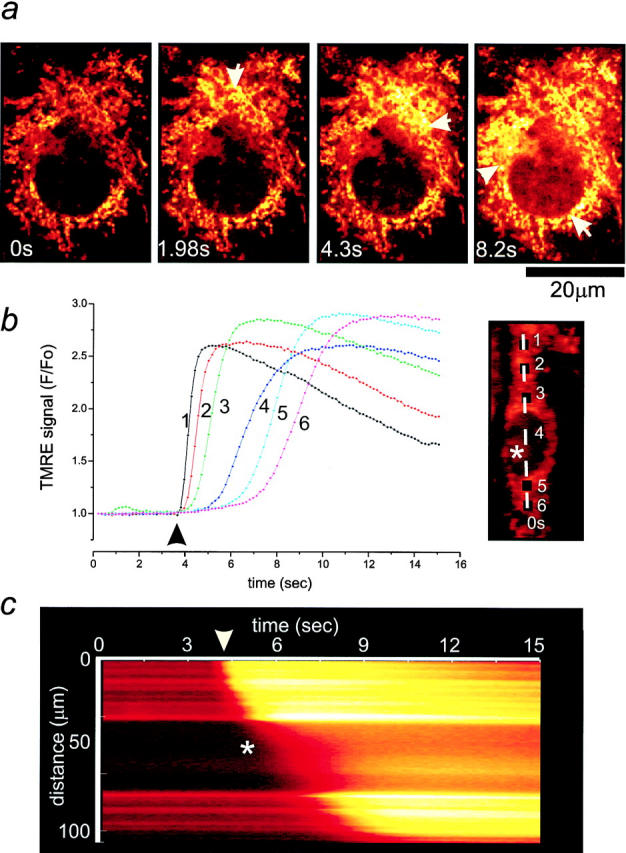
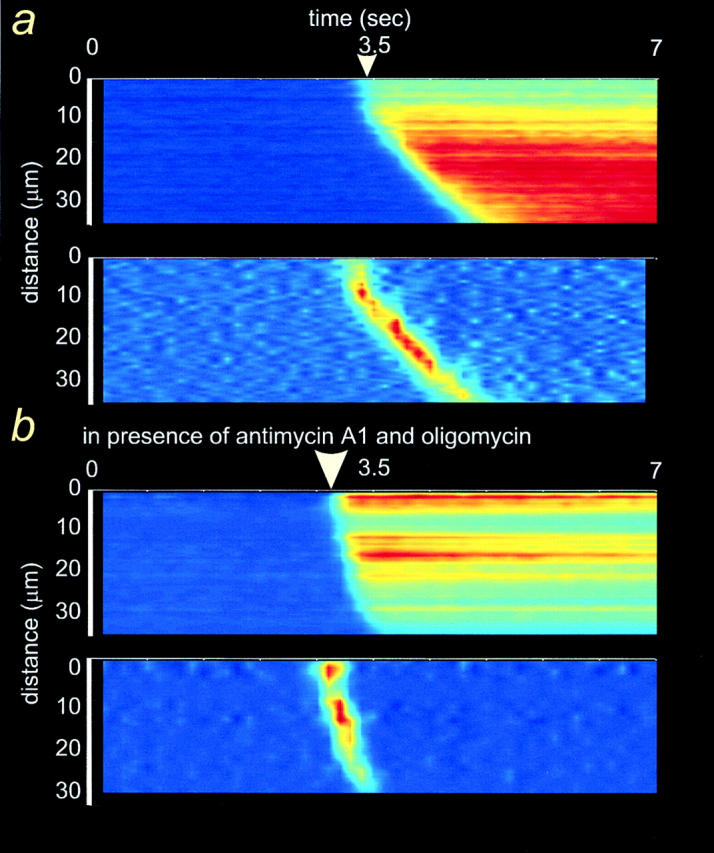
We have used digital fluorescence imaging techniques to explore the interplay between mitochondrial Ca2+ uptake and physiological Ca2+ signaling in rat cortical astrocytes. A rise in cytosolic Ca2+ ([Ca2+]cyt), resulting from mobilization of ER Ca2+ stores was followed by a rise in mitochondrial Ca2+ ([Ca2+]m, monitored using rhod-2). Whereas [Ca2+]cyt recovered within approximately 1 min, the time to recovery for [Ca2+]m was approximately 30 min. Dissipating the mitochondrial membrane potential (Deltapsim, using the mitochondrial uncoupler carbonyl cyanide p-trifluoromethoxy-phenyl-hydrazone [FCCP] with oligomycin) prevented mitochondrial Ca2+ uptake and slowed the rate of decay of [Ca2+]cyt transients, suggesting that mitochondrial Ca2+ uptake plays a significant role in the clearance of physiological [Ca2+]cyt loads in astrocytes. Ca2+ signals in these cells initiated either by receptor-mediated ER Ca2+ release or mechanical stimulation often consisted of propagating waves (measured using fluo-3). In response to either stimulus, the wave traveled at a mean speed of 22.9 +/- 11.2 micrometer/s (n = 262). This was followed by a wave of mitochondrial depolarization (measured using tetramethylrhodamine ethyl ester [TMRE]), consistent with Ca2+ uptake into mitochondria as the Ca2+ wave traveled across the cell. Collapse of Deltapsim to prevent mitochondrial Ca2+ uptake significantly increased the rate of propagation of the Ca2+ waves by 50%. Taken together, these data suggest that cytosolic Ca2+ buffering by mitochondria provides a potent mechanism to regulate the localized spread of astrocytic Ca2+ signals.


Figures

Figure 1
Figure 1
Rhod-2 predominantly localizes within the mitochondria. Confocal fluorescence imaging of an adult rat cortical astrocyte coloaded with rhod-2/ AM (a) and MitoFluor Green/ AM (b), a mitochondrion-specific marker. The two images share striking similarities, suggesting a mainly mitochondrial compartmentalization of rhod-2. In the merged image (c) regions containing both rhod-2 and MitoFluor Green fluorescence appear yellow. (d) Scatter diagram representation of the colocalization. Identical images of rhod-2 and MitoFluor Green fluorescence should produce a clear diagonal line at 45°. Slight differences between the images caused irregular spots in the scatter diagram. The X axis represents the rhod-2 fluorescence signal and the Y axis the MitoFluor Green signal.
Figure 2
Figure 2
Mitochondria take up Ca2+ in response to physiological ATP challenge in astrocytes. (a) Time series of images of a rhod-2–loaded adult rat cortical astrocyte following stimulation with 100 μM ATP. The images have been normalized with respect to the initial control image and the changes in [Ca2+]n (taken as a good index of [Ca2+]cyt, but free of any [Ca2+]m; Al Mohanna et al., 1994) and in [Ca2+]m are seen with time. Note that [Ca2+]n rises immediately after the stimulus and before any change in [Ca2+]m. The asterisk and the ellipse indicate the position of the nucleus. The surface plot shown in b and the corresponding line image shown in c were obtained from the pixel values extracted from the image series along the line selected on the axis of the cell as shown in the first frame of a. b and c illustrate the quantitative evolution of the nuclear and mitochondrial Ca2+ responses to ATP with time. The rapid onset of [Ca2+]n changes was followed by a rise in [Ca2+]m that presented a wavelike pattern (black arrows).
Figure 3
Figure 3
Kinetic characteristics of [Ca2+]n and of [Ca2+]m in response to physiological ATP challenge in astrocytes. Adult rat cortical astrocytes were loaded with the AM ester of rhod-2. (a) High temporal resolution of [Ca2+]n (solid circle) and [Ca2+]m (open circle) transients upon ATP application. Note the slower rise in [Ca2+]m compared with the rapid [Ca2+]n transient. (b) Superimposed time courses of [Ca2+]n (solid circle) and of [Ca2+]m (open circle) after ATP addition. [Ca2+]m slowly decreased back to baseline. (c) Relationship of [Ca2+]m to [Ca2+]n during the response to ATP and subsequent recovery. The nonlinear time course is given for each breakpoint of the curve. When indicated (white bar), the cells were stimulated with a brief puff of 100 μM ATP. The fluorescence intensity before ATP application was normalized to one. Each trace shows the response of a representative cell.
Figure 4
Figure 4
Mitochondrial depolarization prevents mitochondrial Ca2+ uptake. (a) Time series of ratioed images showing the changes in [Ca2+]n and in [Ca2+]cyt occurring in a rhod-2–loaded cortical astrocyte after application of 1 μM FCCP (with 2.5 μg/ml oligomycin) followed by ATP challenge (100 μM). p, c, and n signal a perinuclear, a cytosolic, and the nuclear regions, respectively. Note the absence of any mitochondrial, particulate rhod-2 signal during ATP application. (b) Corresponding time courses of [Ca2+]n (n, closed circle) and [Ca2+]cyt (c and p, open circle) upon application of FCCP/oligomycin and ATP. The rhod-2 fluorescence intensity before addition of ATP was normalized to one against the first image. The surface plot shown in c and the equivalent line image shown in d illustrate the evolution of the nuclear and cytosolic Ca2+responses to FCCP/oligomycin and to ATP with time. The asterisk and the ellipse indicate the position of the nucleus. Note the initial increase in the perinuclear and the cytosolic regions (arrows) upon FCCP application, followed later by a rise in [Ca2+]n. However, ATP elicited a global rise in [Ca2+]cyt and [Ca2+]n. The traces shown in b illustrate the response of a representative cell.
Figure 5
Figure 5
In resting conditions, mitochondria in astrocytes contain substantial releasable Ca2+. Typical time course of Ca2+ release from mitochondria upon application of 1 μM FCCP (in the presence of 2.5 μg/ml oligomycin) in astrocytes dual-loaded with rhod-2/AM and fura-2/AM. The Ca2+ transient monitored using rhod-2 (solid circle) can be superimposed upon that measured using fura-2 (open circle). The rhod-2 fluorescence intensity before addition of FCCP/oligomycin was normalized to one. The nuclear Ca2+ signal monitored by fura-2 was expressed as a ratio of fura-2 fluorescence after excitation at 340 and 380 nm.
Figure 6
Figure 6
Characteristics of the propagating [Ca2+]cyt wave in ATP-stimulated astrocytes. (a) Time series of images showing the propagation of an intracellular Ca2+ wave across a fluo- 3–loaded cortical astrocyte upon ATP challenge (20 μM). (b) Plots of six consecutive areas across the cytoplasm of an astrocyte (at positions 1–6 shown in image inset) following the wave path. Note the sequential and sustained increase in fluorescence in the different regions. (c) Line image to illustrate the propagating wave using data obtained by selecting a line along the axis of the cell (see image inset in b). The asterisk indicates the position of the nucleus. The arrow in b and c signals ATP application.
Figure 7
Figure 7
Propagation of a wave of mitochondrial depolarization induced by mechanical stimulation in astrocytes. (a) Images selected from a time series of confocal images showing the propagation of a wave of mitochondrial depolarization across a TMRE-loaded cortical astrocyte elicited by mechanical stimulation. (b) Plot of six consecutive box areas across another cell (see image inset), following the wave path. Note the sequential and sustained increase in fluorescence in the different regions. (c) Line image of a line trace obtained by drawing a line across the length of the cell (b, image inset). The asterisk marks the position of the nucleus. The arrows in a indicate the progression of the wave. In b and c, the arrow signals mechanical stimulation of the cell.
Figure 8
Figure 8
Inhibition of [Ca2+]m uptake increases the velocity of [Ca2+]cyt waves in astrocytes. Line images of a [Ca2+]cyt wave in ATP-stimulated, fluo-3–loaded astrocytes, in control conditions (a) or after treatment with 2.5 μg/ml antimycin A1 and 2.5 μg/ml oligomycin (b). The differentiated line image given in the lower part of each frame shows the wavefront propagating through the cell. The [Ca2+]cyt wave traveled faster across the antimycin-treated cells. The horizontal axis shows time and the vertical axis represents the distance across the cell. The arrow marks chemical stimulation.

References

    1. al Mohanna, F.A., K.W. Caddy, and S.R. Bolsover. The nucleus is insulated from large cytosolic calcium ion changes. Nature. 1994;367:745–750. - PubMed
    1. Babcock DF, Herrington J, Goodwin PC, Park YB, Hille B. Mitochondrial participation in the intracellular Ca2+network. J Cell Biol. 1997;136:833–844. - PMC - PubMed
    1. Bernardi P, Broekemeier KM, Pfeiffer DR. Recent progress on regulation of the mitochondrial permeability transition pore, a cyclosporin-sensitive pore in the inner mitochondrial membrane. J Bioenerg Biomembr. 1994;26:509–517. - PubMed
    1. Berridge MJ. Inositol trisphosphate and calcium signalling. Nature. 1993;361:315–325. - PubMed
    1. Bezprozvanny I, Watras J, Ehrlich BE. Bell-shaped calcium-response curves of Ins(1,4,5)P3- and calcium-gated channels from endoplasmic reticulum of cerebellum. Nature. 1991;351:751–754. - PubMed

Publication types