. 1999 May 15;103(10):1469-77.
doi: 10.1172/JCI6400.

Distinct roles of prostaglandin H synthases 1 and 2 in T-cell development

Affiliations

Distinct roles of prostaglandin H synthases 1 and 2 in T-cell development

B Rocca et al. J Clin Invest. .

Abstract

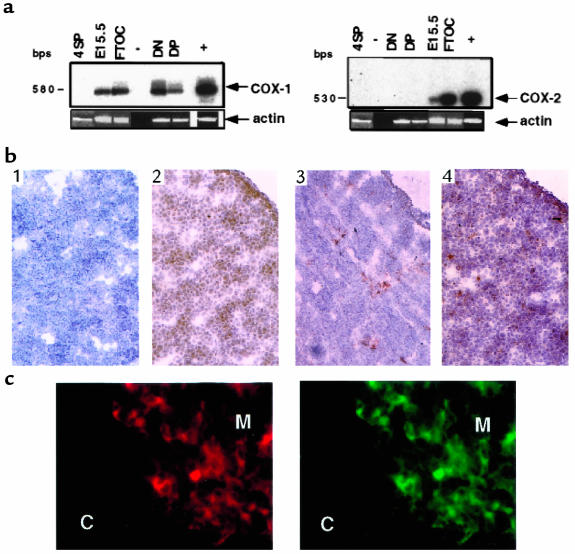
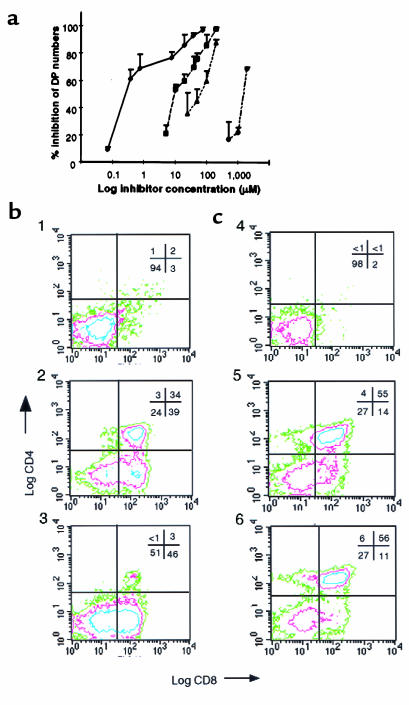
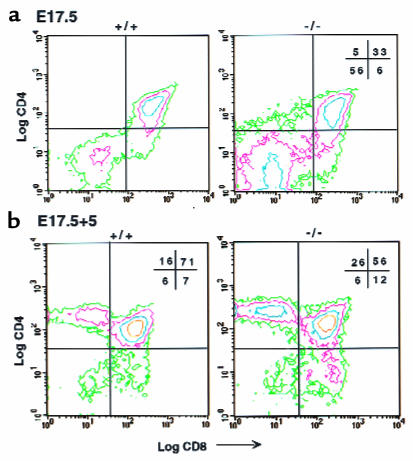
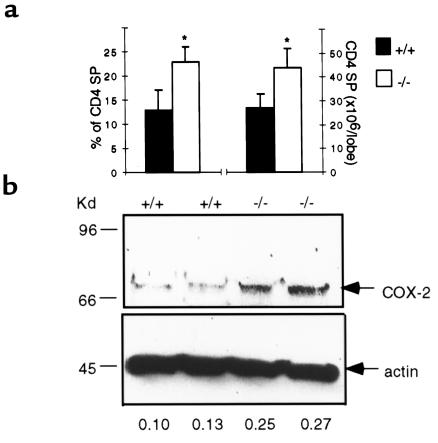
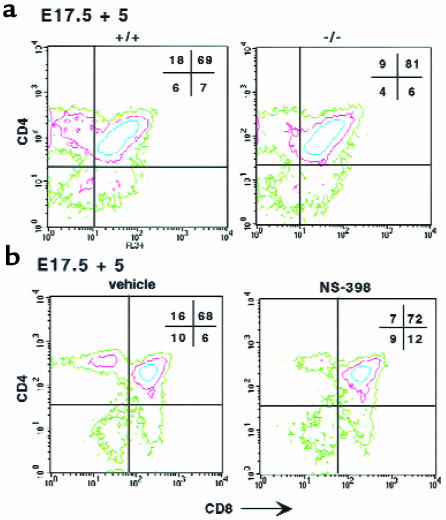
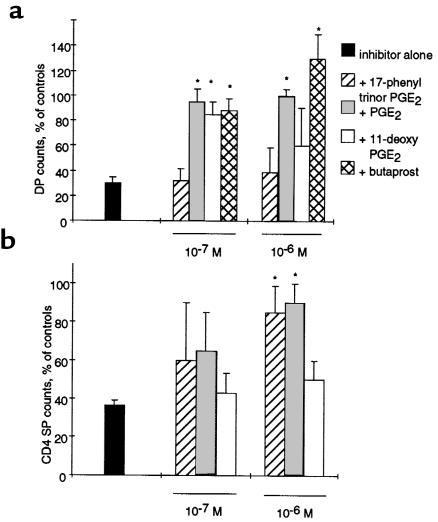
Prostaglandin G and H synthases, or cyclooxygenases (COXs), catalyze the formation of prostaglandins (PGs). Whereas COX-1 is diffusely expressed in lymphoid cells in embryonic day 15.5 thymus, COX-2 expression is sparse, apparently limited to stromal cells. By contrast, COX-2 is predominant in a subset of medullary stromal cells in three- to five-week-old mice. The isozymes also differ in their contributions to lymphocyte development. Thus, experiments with selective COX-1 inhibitors in thymic lobes from normal and recombinase-activating gene-1 knockout mice support a role for this isoform in the transition from CD4(-)CD8(-) double-negative (DN) to CD4(+)CD8(+) double-positive (DP). Concordant data were obtained in COX-1 knockouts. Pharmacological inhibition and genetic deletion of COX-2, by contrast, support its role during early thymocyte proliferation and differentiation and, later, during maturation of the CD4 helper T-cell lineage. PGE2, but not other PGs, can rescue the effects of inhibition of either isoform, although it acts through distinct EP receptor subtypes. COX-dependent PG generation may represent a mechanism of thymic stromal support for T-cell development.


Figures

Figure 1
Figure 1
Characterization of COX-1 and COX-2 mRNA and protein expression. (a) Total RNA from indicated tissues or fractions was isolated, and cDNAs were amplified by RT-PCR using primers specific for COX-1 (left), COX-2 (right), or actin (see Methods). The identity of the amplified fragments for COX-1 or COX-2 was confirmed by Southern blot analysis with specific probes. –, negative control; +, positive control (NIH 3T3 cells); DN, CD4CD8 thymocytes; DP, CD4+CD8+ thymocytes; 4SP, CD4+ lymphocytes; E15.5, embryonic day 15.5 thymus; FTOC, E15.5 thymus cultured for 5 days. (b) Frozen sections of E15.5 thymus were reacted with normal rabbit IgG as a negative control (panel 1), anti–COX-1 (panel 2), anti–COX-2 (panel 3), and anti–Thy 1.2 (panel 4). Sections were counterstained with hematoxylin. ×40. (c) Frozen sections of thymus from 3-week-old mice were double stained with UEA-1 lectin (left) and anti–COX-2 (right). C, cortex; M, medulla. ×100.
Figure 2
Figure 2
Effect of COX-1 inhibition on DP formation. (a) E15.5 FTOCs were treated with different concentrations of L-759,700 (filled diamonds), indomethacin (filled squares), ibuprofen (filled triangles), or valeryl salicylate (open circles) for 5 days of culture. The percent inhibition of the DP absolute counts is expressed relative to vehicle-treated FTOCs. Values are means ± SD of 3–6 different experiments, each performed in quadruplicate. (b) Effect of the selective COX-1 inhibitor L-759,700 on E15.5 RAG-1–/– FTOCs. The panels show a representative experiment in which RAG-1–/– thymic lobes were cultured in the presence of vehicle (panel 1), anti-CD3ε mAb (25 μg/mL medium) (panel 2), or anti-CD3ε mAb (25 μg/mL medium) plus L-759,700 (7 μM) (panel 3). (c) Effect of the selective COX-2 inhibitor NS-398 on E15.5 RAG-1–/– FTOCs. RAG-1–/– thymic lobes were cultured for 5 days and analyzed for CD4 and CD8 expression by flow cytometry. Conditions were as follows: vehicle (panel 4), anti-CD3ε mAb (25 μg/mL medium) (panel 5), or anti-CD3ε mAb (25 μg/mL medium) plus NS-398 (40 μM) (panel 6).
Figure 3
Figure 3
Flow cytometry analysis of thymocytes from E17.5 and E18.5 FTOCs treated with selective COX-1 inhibitor. Thymocytes from E17.5 plus 5 days culture in FTOCs were examined for CD4 and CD8 expression. (a) Vehicle. (b) L-759,700, 10 μM. The percentage of cells in each quadrant are indicated in the corners of each graph. (c) E15.5 (filled circles), E17.5 (filled squares), and E18.5 (filled triangles) FTOCs were treated with different concentrations of L-759,700. The percent inhibition of the DP absolute counts is expressed relative to vehicle-treated FTOCs. Values are means ± SD of 3–6 different experiments, each performed in quadruplicate.
Figure 4
Figure 4
Flow cytometry analysis of thymocytes from E17.5 thymi and from E17.5 cultured COX-1–/– and control thymi. Thymocytes from COX-1–/– and control mice were examined for CD4 and CD8 expression. (a) E17.5 thymi. (b) E17.5 thymi in culture 5 days. +/+, controls; –/–, COX-1–/– mice. The percentage of cells in each quadrant is indicated in the corners of each graph.
Figure 5
Figure 5
CD4 SP cells and COX-2 protein levels in COX-1–/– and wild-type thymi. (a) Thymocytes were isolated from adult (5-week-old) thymi, counted, and analyzed by flow cytometry. The percentage and absolute counts of CD4 SP cells are shown in the graphs. *P < 0.01 vs. controls; n = 4 each group. (b) Western blot analysis using proteins (50 μg) extracted from 5-week-old thymi and using antibodies specific for COX-2 or β-actin as controls. The numbers indicate the actin/COX-2 ratios of the densitometric values of the bands. +/+, wild-type mice; –/–, COX-1–/– mice.
Figure 6
Figure 6
Flow cytometric analyses of thymocytes from COX-2–/– E17.5 FTOCs and wild-type E17.5 FTOCs in the presence of COX-2 inhibitors. (a) E17.5 thymi were isolated from COX-2–/– embryos (–/–) and control siblings (+/+) and cultured for 5 days. Thymocytes were analyzed for CD4 and CD8 expression by flow cytometry. The contour plots are shown. Percentages are indicated in the corner of each quadrant. (b) The same experiments and analyses were performed in wild-type E17.5 FTOCs in the presence of the selective COX-2 inhibitor NS-398 (40 μM) or vehicle.
Figure 7
Figure 7
Effect of PGE2 and its analogues in inhibitor-treated FTOCs. (a) E15.5 FTOCs were treated with indomethacin (40 μM) in the presence or absence of different concentrations of PGE2 or its synthetic analogues. After 5 days of culture, thymic lobes were dissociated, and the thymocytes were counted and stained for CD4 and CD8. DP counts are expressed in the graphs as the percentage of vehicle-treated FTOCs (100%). (b) The same experiments were performed with E17.5 FTOCs in the presence of 40 μM NS-398, and the CD4 SP cells were considered for the analyses. *P < 0.01 vs. inhibitor-treated FTOCs.
Figure 8
Figure 8
Simplified model of the possible role of COX-1, COX-2, PGs, and PG receptors during T-cell development. COX-1–dependent PGE2 synthesis is required for an efficient transition of thymocytes from DN to DP. In this model, an autocrine effect of PGE2 acting on the EP2 receptor of immature thymocytes is hypothesized. However, we cannot exclude an effect of COX-1 in stromal cells. COX-2–dependent PG production positively affects the DN population, and it is also required for CD4 SP formation. We hypothesize a paracrine effect of PGE2 formed by stromal cell COX-2 acting on thymocyte EP1 receptors in positive selection. It is also possible that COX-2–dependent PG production may also act on the stromal cells in an autocrine fashion.

References

    1. Smith WL, DeWitt DL. Prostaglandin endoperoxide H synthases -1 and -2. Adv Immunol. 1996;62:167–215. - PubMed
    1. Herschman HR, Reddy ST, Xie W. Function and regulation of prostaglandin synthase-2. Adv Exp Med Biol. 1997;407:61–66. - PubMed
    1. Betz M, Fox BS. Prostaglandin E2 inhibits production of Th1 lymphokines but not of Th2 lymphokines. J Immunol. 1991;146:108–113. - PubMed
    1. Anastassiou ED, Paliogianni F, Balow JP, Yamada H, Boumpas DT. Prostaglandin E2 and other cyclic AMP-elevating agents modulate IL-2 and IL-2R alpha gene expression at multiple levels. J Immunol. 1992;148:2845–2852. - PubMed
    1. Paliogianni F, Kincaid RL, Boumpas DT. Prostaglandin E2 and other cyclic AMP elevating agents inhibit interleukin 2 gene transcription by counteracting calcineurin-dependent pathways. J Exp Med. 1993;178:1813–1817. - PMC - PubMed

Publication types

MeSH terms