. 1999 May 17;189(10):1531-44.
doi: 10.1084/jem.189.10.1531.

A kinetic threshold between negative and positive selection based on the longevity of the T cell receptor-ligand complex

Affiliations

A kinetic threshold between negative and positive selection based on the longevity of the T cell receptor-ligand complex

C B Williams et al. J Exp Med. .

Abstract

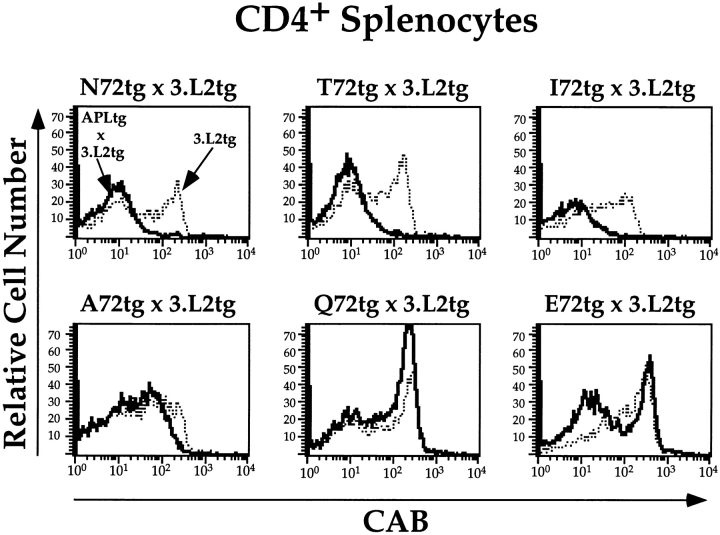
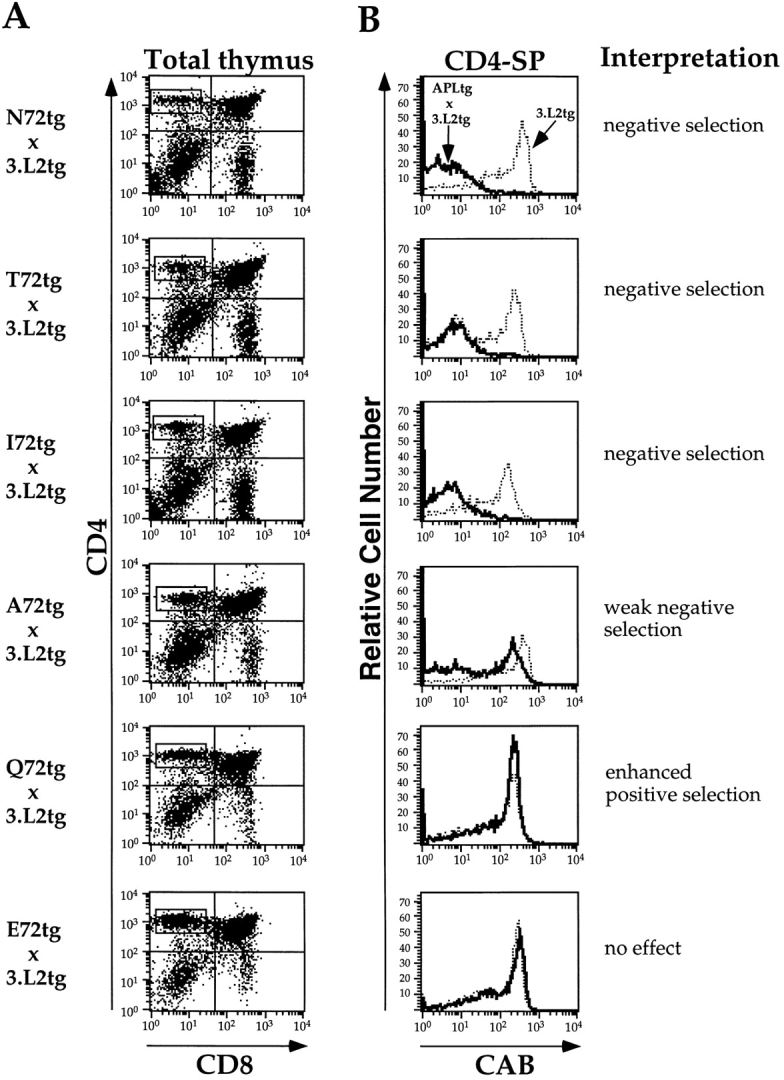
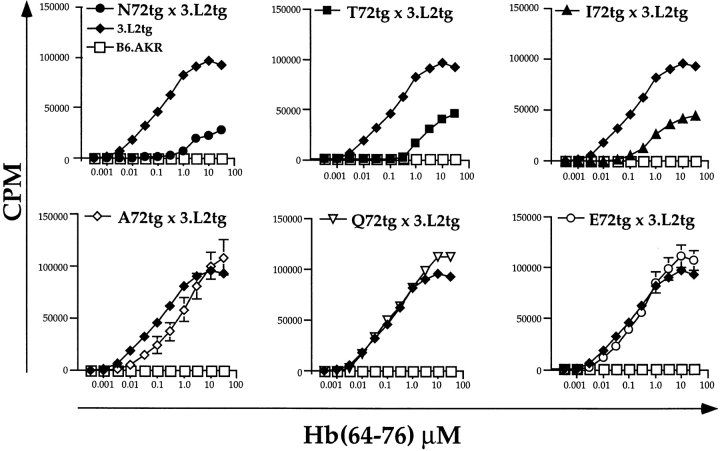
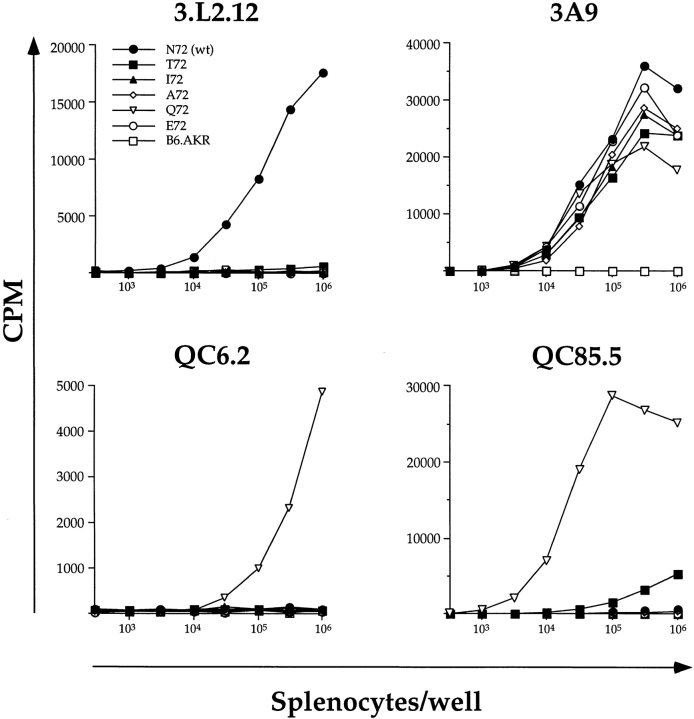
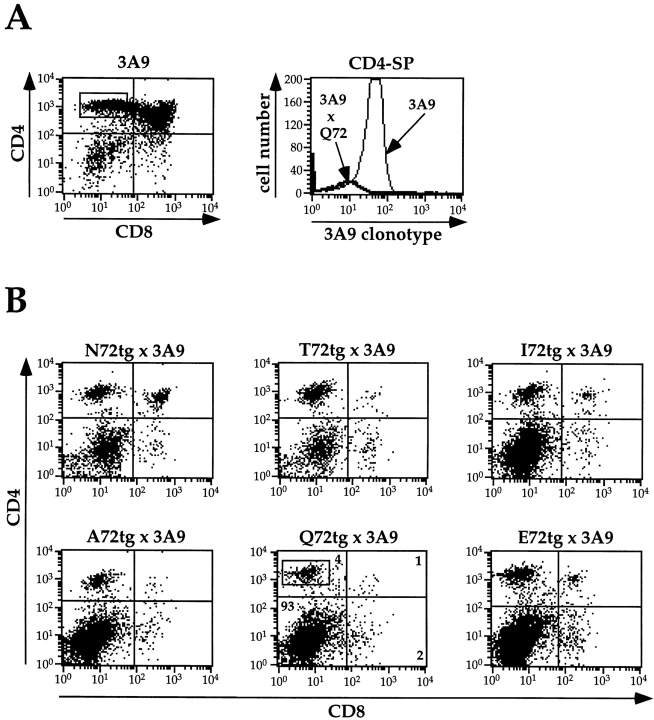
We have developed a unique in vivo system to determine the relationship between endogenous altered peptide ligands and the development of major histocompatibility complex class II- restricted T cells. Our studies use the 3.L2 T cell receptor (TCR) transgenic mouse, in which T cells are specific for Hb(64-76)/I-Ek and positively selected on I-Ek plus self-peptides. To this endogenous peptide repertoire, we have individually added one of six well-characterized 3.L2 ligands. This transgenic approach expands rather than constrains the repertoire of self-peptides. We find that a broad range of ligands produce negative selection of thymocytes in vivo. When compared with the in vitro TCR-ligand binding kinetics, we find that these negatively selecting ligands all have a half-life of 2 s or greater. Additionally, one of two ligands examined with no detectable binding to the 3.L2 TCR and no activity on mature 3.L2 T cells (Q72) enhances the positive selection of transgenic thymocytes in vivo. Together, these data establish a kinetic threshold between negative and positive selection based on the longevity of TCR-ligand complexes.


Figures

Figure 4
Figure 4
The number of CAB+ cells in the periphery of APLtg × 3.L2tg mice reflects the effect of the APL on thymic selection. Three-color FACS® analysis was performed on splenocytes from APLtg × 3.L2tg mice and 3.L2tg littermate controls. Splenocytes were stained for CD4 (PE), CD8 (FITC), and the 3.L2 clonotypic receptor (CAB-biotin plus Tricolor-streptavidin), and 105 live cell events were collected per sample. Results were first examined as dot plots of CD4 versus CD8 (not shown), and the CD4+ region was selected for further analysis. The level of 3.L2 clonotypic TCR expression was determined in this population of cells, and the results were plotted as histograms of cell number versus log10 fluorescence. Representative histograms are shown for each APLtg × 3.L2tg (solid lines) and for 3.L2tg littermate controls (dotted lines).
Figure 1
Figure 1
All mHEL/APL transgenes are expressed in both the thymic cortex and thymic medulla. Frozen thymic sections were stained for either an HEL epitope common to all transgenes (A–F, I, and J) or I-Ek (G and H) as described in Materials and Methods. The original magnification of all photographs is 20× unless otherwise specified. The cortex (C) and medulla (M) of each section are labeled. Note that mHEL/APL expression in the thymus did not influence MHC class II expression (shown only for the E72 and Q72 lines in G and H, respectively). Also, the relative intensity of fluorescence detected with the anti-HEL antibody matched that seen by FACS® analysis of splenocytes using the same primary reagent [N72(wt) > T72 > E72 > I72 > A72 > Q72]. A–F, K, and L are from a representative experiment in which all photographs shown were taken on the same camera settings (14-s exposure, gain of 4; original magnification: 20×). G–J were from another experiment: G is the E72 thymus stained for I-Ek (6-s exposure, gain of 4; original magnification: 20×); H is the Q72 thymic cortex stained for I-Ek (8-s exposure, gain of 2; original magnification: 40×); I is the N72(wt) thymic cortex stained for mHEL/APL expression (12-s exposure, gain of 8; original magnification: 40×); J is the Q72 thymic cortex stained for mHEL/ APL expression (14-s exposure, gain of 4; original magnification: 40×). The mHEL/APL-specific antibody does not bind nontransgenic thymus (K), and there is no nonspecific binding of the streptavidin-Cy3 reagent (L). This entire experiment was repeated four times with similar results.
Figure 2
Figure 2
The mHEL/APL transgenes are expressed in all MHC class II– positive cells. Splenocytes from each transgenic line were stained for HEL epitopes common to all transgenes and I-Ek using mAbs. Dot plots from two-color FACS® analysis of stained cells from one of five similar experiments are shown (log10 fluorescence). All experiments demonstrate expression of the transgenes in MHC class II–positive splenocytes at comparable levels. Transgene expression using the Eα promoter does not influence endogenous class II expression.
Figure 3
Figure 3
The effects of APLs on the thymic selection correlate with the relative activity of these ligands on mature T cells. (A) Three-color FACS® analysis of thymocytes derived from APLtg × 3.L2tg F1 mice was performed, with 105 live cell events collected per sample. The results were first examined as dot plots of CD4 (PE) versus CD8 (FITC), and the CD4-SP region was selected for further analysis. Representative thymi are depicted (log10 fluorescence), with the results from all mice summarized in Table II. (B) The CD4-SP gates in A were analyzed for expression of the 3.L2 clonotypic receptor (CAB-biotin plus Tricolor-streptavidin). The results are shown as histograms of cell number versus log10 fluorescence for both APLtg × 3.L2tg mice (solid lines) and 3.L2tg littermate controls (dotted lines). The ligands are listed in terms of their relative activity on mature T cells from strongest (top) to weakest (bottom) (reference 48). The interpretation, based on the cumulative observed effects for each APL, is listed beside the histogram.
Figure 5
Figure 5
The proliferative responses of naive splenocytes from APLtg × 3.L2tg mice are consistent with the observed effects of these ligands on T cell development. They also demonstrate that T cells selected on the Q72 background are functional. The proliferative responses were measured by tritiated thymidine incorporation. Splenocytes (5 × 10⁵/well) were added along with the indicated concentrations of Hb(64– 76) peptide. Cells were incubated for 48 h, pulsed with tritiated thymidine for 18 h, harvested, and counted. Within a given experiment, triplicate wells were performed at each peptide concentration, and the mean cpm was determined. Each experiment was repeated several times. Symbols are as follows: •, N72tg (n = 5); ▪, T72tg (n = 9); ▴, I72tg (n = 11); ⋄, A72tg (n = 8); ▿, Q72tg (n = 16); ♦, 3.L2tg (n = 20); and □, B6.AKR (n = 5). The data shown represent the average of these experiments, with the error calculated as SEM. The 3.L2tg and B6.AKR controls are shown in each panel for comparison.
Figure 6
Figure 6
Both Hb-related APL and HEL(46–61) epitopes from the chimeric proteins are processed and presented. Splenocytes from each transgenic line were used as APCs in hybridoma proliferation assays to demonstrate properly processed and presented APL and HEL epitopes. In brief, increasing numbers of splenocytes per well (3 × 10² to 1 × 10⁶) were added to a fixed number of T cell hybridoma cells per well (105). The cells were incubated for 24 h, after which 100 ml of supernatant was removed and assayed for IL-2 content by CTLL-2 assay. Results are plotted as the cpm incorporated in the CTLL-2 assay versus the number of splenocytes per well in the original culture. Each datapoint is the mean of triplicate wells. Considering the spectrum of APLs used in this report, 3.L2.12 hybridoma is specific for Hb(64– 76)/I-Ek and stimulated weakly by T72; QC6.2 is specific for Q72/I-Ek; QC85.5 is specific for Q72/I-Ek and stimulated weakly by T72, N72(wt), and A72; and 3.A9 is specific for HEL(46–61)/I-Ak. Most weak responses are not visible in the context of the scale used for the predominant response. This experiment was performed five times with similar results, all of which clearly demonstrate processing and presentation of APL and HEL epitopes from the transgenic proteins. Symbols are as follows: •, N72tg; ▪, T72tg; ▴, I72tg; ⋄, A72tg; ▿, Q72tg; ○, E72tg; and □, the B6.AKR control.
Figure 7
Figure 7
Expression of the mHEL/APL transgenic proteins in the thymus results in complete negative selection of 3A9 transgenic T cells. (A) Three-color FACS® analysis was performed on the mice described in Table III. The left panel shows a dot plot of CD4 (PE) versus CD8 (FITC) for a representative control 3A9 TCR transgenic mouse (log10 fluorescence). From this plot, the CD4-SP region was selected for further analysis of 3A9 clonotypic TCR expression. Shown in the right panel are representative histograms derived from the CD4-SP region of the 3A9 control and the Q72tg × 3A9 mouse shown in B. The histogram plots the log10 fluorescence (biotinylated 3A9 clonotypic antibody plus Tricolor-streptavidin) and the number of cells with the 3A9 TCR in these populations. The results clearly demonstrate the complete loss of all CD4-SP, 3A9 TCRhi thymocytes in Q72tg × 3A9 mice. Identical results were obtained with all other APLtg × 3A9 mice (not shown). (B) Three-color FACS® analysis was performed on the APLtg × 3A9 mice described in Table III. Representative dot plots of CD4 (PE) versus CD8 (FITC) are shown. Compared with the 3A9 control in Fig. 7 A, all mice show a characteristic loss of DP and CD4-SP thymocytes consistent with negative selection. Thus, these data directly demonstrate that all transgenes are expressed, processed, and presented by thymic APCs.

Similar articles

Cited by

References

    1. Kappler JW, Noehm N, Marrack P. T cell tolerance by clonal elimination in the thymus. Cell. 1987;49:273–280. - PubMed
    1. MacDonald HR, Schneider R, Lees RK, Howe RC, Acha-Orbea H, Festenstein H, Zinkernagel RM, Hengartner H. T-cell receptor Vβ use predicts reactivity and tolerance to Mlsa-encoded antigens. Nature. 1988;332:40–45. - PubMed
    1. Kisielow P, Blüthmann H, Staerz UD, Steinmetz M, von Boehmer H. Tolerance in T-cell-receptor transgenic mice involves deletion of nonmature CD4+8+thymocytes. Nature. 1988;333:742–746. - PubMed
    1. Sha WC, Nelson CA, Newberry RD, Kranz DM, Russell JH, Loh DY. Positive and negative selection of an antigen receptor on T cells in transgenic mice. Nature. 1988;336:73–79. - PubMed
    1. Bevan MJ. In a radiation chimera host H-2 antigens determine the immune responsiveness of donor cytotoxic cells. Nature. 1977;269:417–419. - PubMed

Publication types

MeSH terms