

Protein kinase C activators induce membrane retrieval of type II Na+-phosphate cotransporters expressed in Xenopus oocytes
- PMID: 10332085
- PMCID: PMC2269344
- DOI: 10.1111/j.1469-7793.1999.0327t.x
Protein kinase C activators induce membrane retrieval of type II Na+-phosphate cotransporters expressed in Xenopus oocytes
Abstract
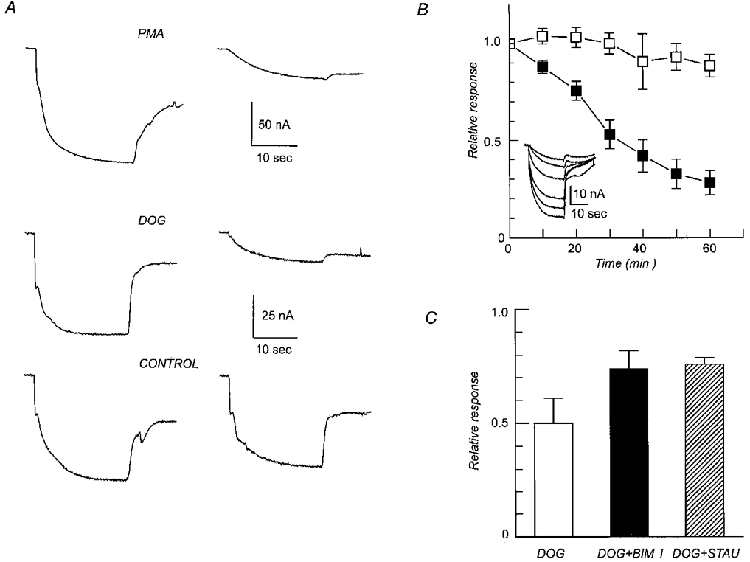
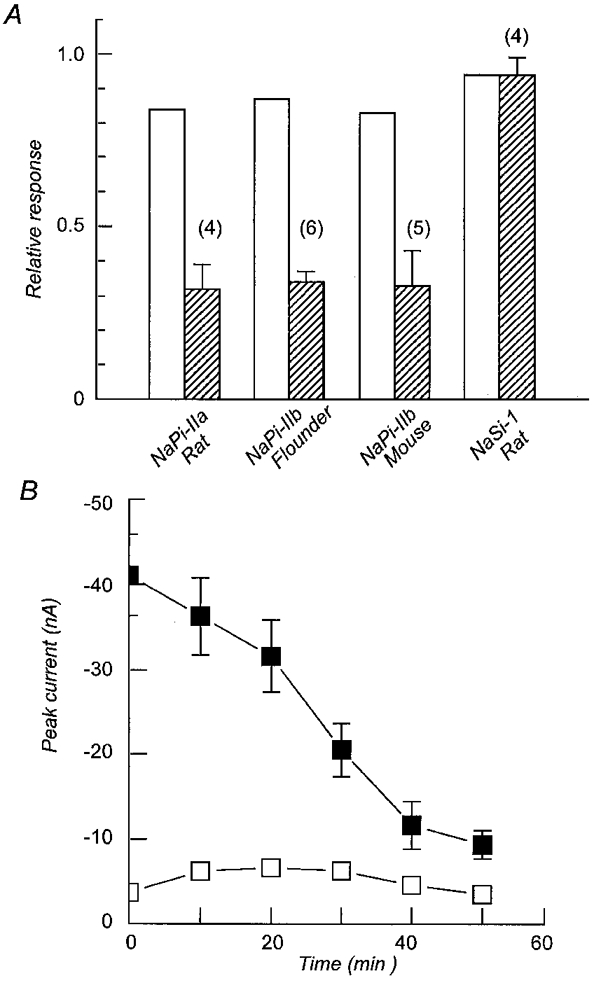
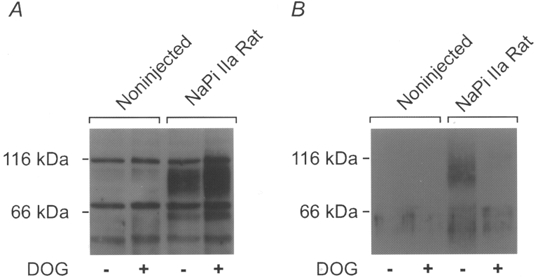
1. The rate of inorganic phosphate (Pi) reabsorption in the mammalian kidney is determined by the amount of type II sodium-coupled inorganic phosphate (Na+-Pi) cotransport protein present in the brush border membrane. Under physiological conditions, parathyroid hormone (PTH) leads to an inhibition of Na+-Pi cotransport activity, most probably mediated by the protein kinase A (PKA) and/or C (PKC) pathways. 2. In this study, PKC-induced inhibition of type II Na+-Pi cotransport activity was characterized in Xenopus laevis oocytes using electrophysiological and immunodetection techniques. Transport function was quantified in terms of Pi-activated current. 3. Oocytes expressing the type IIa rat renal, type IIb flounder renal or type IIb mouse intestinal Na+-Pi cotransporters lost > 50 % of Pi-activated transport function when exposed to the PKC activators DOG (1,2-dioctanoyl-sn-glycerol) or PMA (phorbol 12-myristate 13-acetate). DOG-induced inhibition was partially reduced with the PKC inhibitors staurosporine and bisindolylmaleimide I. Oocytes exposed to the inactive phorbol ester 4alpha-PDD (4alpha-phorbol 12,13-didecanoate) showed no significant loss of cotransporter function. 4. Oocytes expressing the rat renal Na+-SO42- cotransporter alone, or coexpressing this with the type IIa rat renal Na+-Pi cotransporter, showed no downregulation of SO42--activated cotransport activity by DOG. 5. Steady-state and presteady-state voltage-dependent kinetics of type II Na+-Pi cotransporter function were unaffected by DOG. 6. DOG induced a decrease in membrane capacitance which indicated a reduction in membrane area, thereby providing evidence for PKC-mediated endocytosis. 7. Immunocytochemical studies showed a redistribution of type II Na+-Pi cotransporters from the oolemma to the submembrane region after DOG treatment. Surface biotinylation confirmed a DOG-induced internalization of the transport protein. 8. These findings document a specific retrieval of exogenous type II Na+-Pi cotransporters induced by activation of a PKC pathway in the Xenopus oocyte.
Figures
 , cells expressing the indicated RNA incubated in ND96 and 5 μ
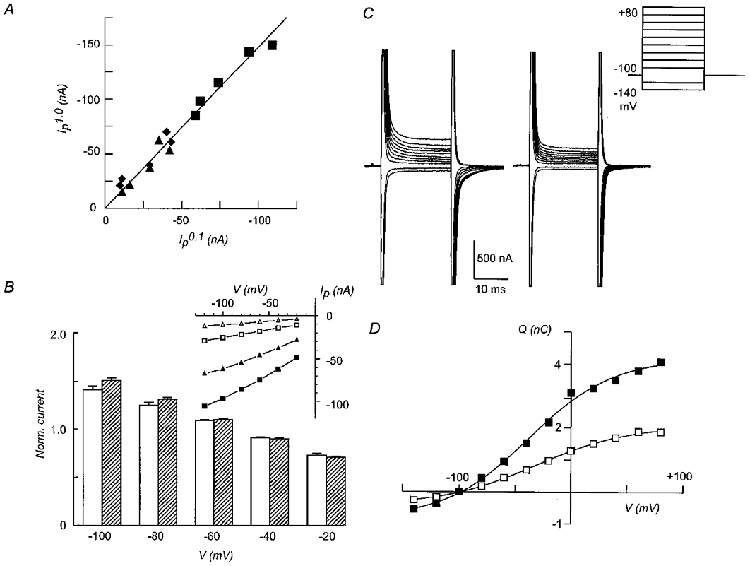 ) exposure to DOG (n = 4). Each bar is the response to 1 mM Pi at the indicated voltage normalized to the respective response at -50 mV. Data were obtained from I-V curves such as that shown in the inset for a typical oocyte expressing NaPi-IIa/rat at the start (▪, ▴) and after 60 min incubation in DOG (5 μ
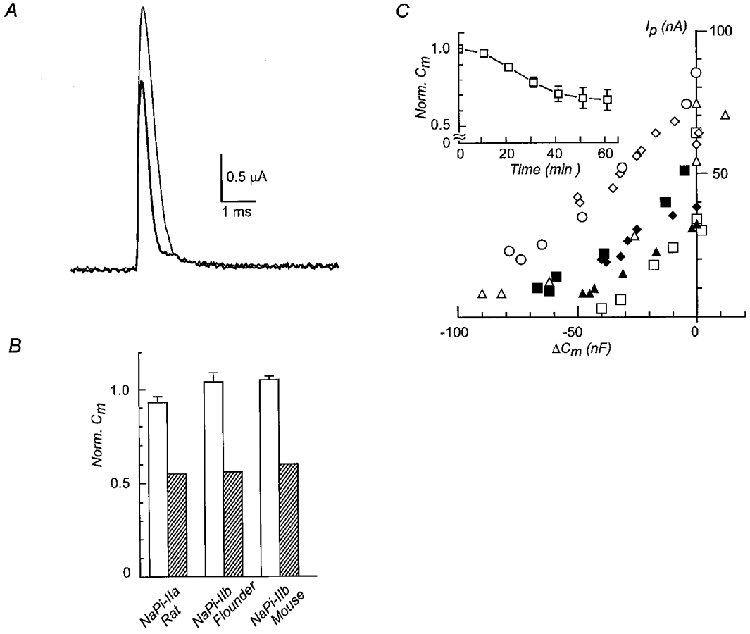 ). Pooled results of non-injected oocytes from the same batch as for the respective injected oocyte, incubated under the same conditions, are also shown (□) (n = 4). The capacitance after 60 min was normalized to the value prior to incubation in each case. C, the isochronic plot of Pi-activated current (Ip) (-50 mV, 1 mM Pi) against the corresponding change in membrane capacitance (ΔCm) relative to the initial value, for seven individual oocytes expressing NaPi-IIa/rat and incubated in DOG (5 μ
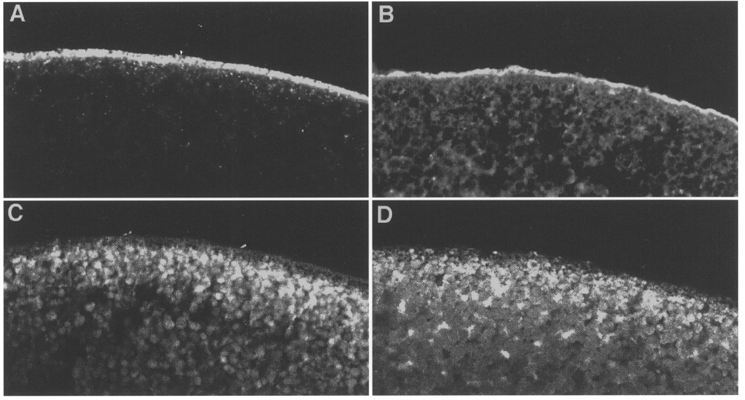
Similar articles
-
Amino acids involved in sodium interaction of murine type II Na(+)-P(i) cotransporters expressed in Xenopus oocytes.J Physiol. 2001 Mar 1;531(Pt 2):383-91. doi: 10.1111/j.1469-7793.2001.0383i.x. J Physiol. 2001. PMID: 11230511 Free PMC article.
-
Characterization of a murine type II sodium-phosphate cotransporter expressed in mammalian small intestine.Proc Natl Acad Sci U S A. 1998 Nov 24;95(24):14564-9. doi: 10.1073/pnas.95.24.14564. Proc Natl Acad Sci U S A. 1998. PMID: 9826740 Free PMC article.
-
Protein kinase C consensus sites and the regulation of renal Na/Pi-cotransport (NaPi-2) expressed in XENOPUS laevis oocytes.Pflugers Arch. 1995 Sep;430(5):819-24. doi: 10.1007/BF00386181. Pflugers Arch. 1995. PMID: 7478938
-
Renal brush border membrane Na/Pi-cotransport: molecular aspects in PTH-dependent and dietary regulation.Kidney Int. 1996 Jun;49(6):1769-73. doi: 10.1038/ki.1996.264. Kidney Int. 1996. PMID: 8743494 Review.
-
Regulation of Na+/glucose cotransporters.J Exp Biol. 1997 Jan;200(Pt 2):287-93. doi: 10.1242/jeb.200.2.287. J Exp Biol. 1997. PMID: 9050236 Review.
Cited by
-
Regulation of the human Na+-dependent glucose cotransporter hSGLT2.Am J Physiol Cell Physiol. 2012 Aug 1;303(3):C348-54. doi: 10.1152/ajpcell.00115.2012. Epub 2012 Jun 6. Am J Physiol Cell Physiol. 2012. PMID: 22673616 Free PMC article.
-
Turnover rate of the gamma-aminobutyric acid transporter GAT1.J Membr Biol. 2007 Dec;220(1-3):33-51. doi: 10.1007/s00232-007-9073-5. Epub 2007 Nov 9. J Membr Biol. 2007. PMID: 17994179 Free PMC article.
-
A dibasic motif involved in parathyroid hormone-induced down-regulation of the type IIa NaPi cotransporter.Proc Natl Acad Sci U S A. 2000 Nov 7;97(23):12896-901. doi: 10.1073/pnas.220394197. Proc Natl Acad Sci U S A. 2000. PMID: 11050158 Free PMC article.
-
Proton-sensitive transitions of renal type II Na(+)-coupled phosphate cotransporter kinetics.Biophys J. 2000 Jul;79(1):215-30. doi: 10.1016/S0006-3495(00)76285-0. Biophys J. 2000. PMID: 10866949 Free PMC article.
-
Two PKC consensus sites on human acid-sensing ion channel 1b differentially regulate its function.Am J Physiol Cell Physiol. 2009 Feb;296(2):C372-84. doi: 10.1152/ajpcell.00200.2008. Epub 2008 Dec 17. Am J Physiol Cell Physiol. 2009. PMID: 19091960 Free PMC article.
References
-
- Amstutz M, Morhmann M, Gmaj P, Murer M. Effect of pH on phosphate transport in rat renal brush-border membrane vesicles. American Journal of Physiology. 1985;248:F705–710. - PubMed
-
- Busch AE, Waldegger S, Herzer T, Biber J, Markovich D, Murer H, Lang F. Electrogenic cotransport of Na+ and sulfate in Xenopus oocytes expressing the cloned Na+/SO42- transport protein NaSi-1. Journal of Biological Chemistry. 1994b;269:12407–12409. - PubMed
-
- Caverzasio J, Rizzoli R, Bonjour J-P. Sodium-dependent phosphate transport inhibited by parathyroid hormone and cyclic AMP stimulation in an opossum kidney cell line. Journal of Biological Chemistry. 1986;261:3233–3237. - PubMed
-
- Corey JL, Davidson N, Lester HA, Brecha N, Quick M. Protein kinase C modulates the activity of a cloned γ-aminobutyric acid transporter expressed in Xenopus oocytes via regulated subcellular redistribution of the transporter. Journal of Biological Chemistry. 1994;269:14759–14767. - PubMed
Publication types
MeSH terms
Substances
LinkOut - more resources
Full Text Sources
Molecular Biology Databases
Research Materials
Miscellaneous