

Regulation of Na+-K+-2Cl- cotransport in turkey red cells: the role of oxygen tension and protein phosphorylation
- PMID: 10332092
- PMCID: PMC2269353
- DOI: 10.1111/j.1469-7793.1999.0421t.x
Regulation of Na+-K+-2Cl- cotransport in turkey red cells: the role of oxygen tension and protein phosphorylation
Abstract
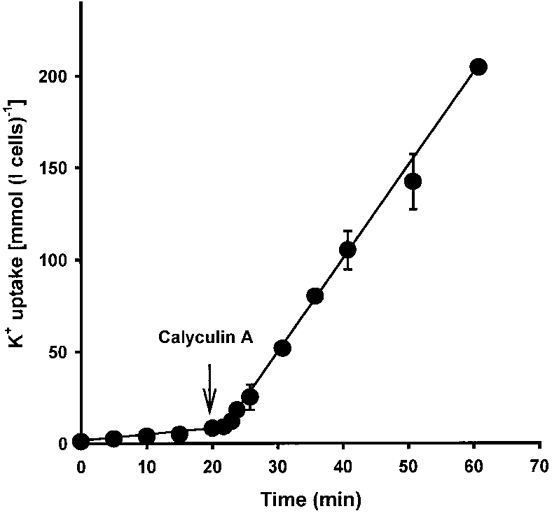
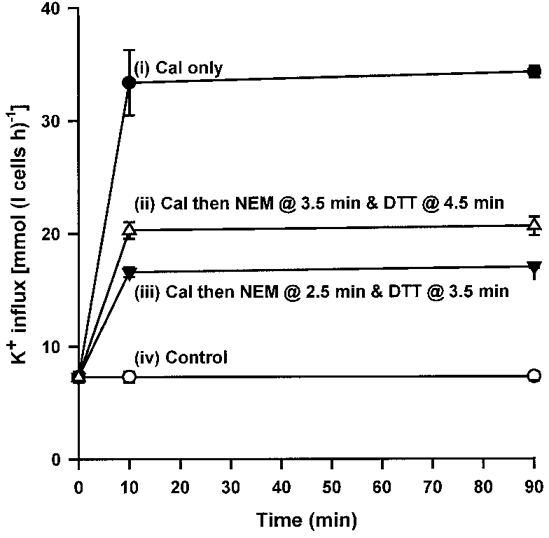
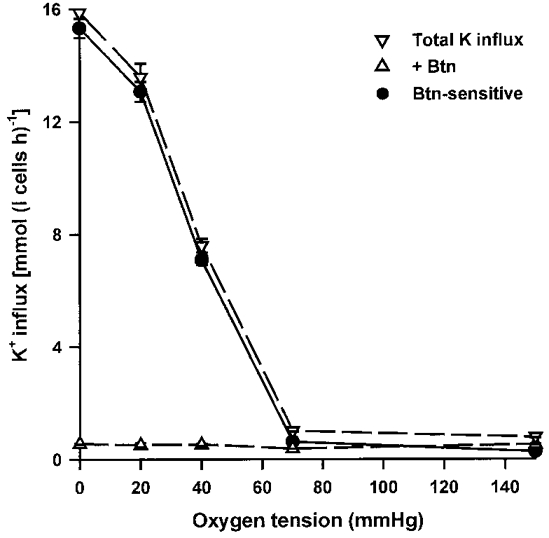
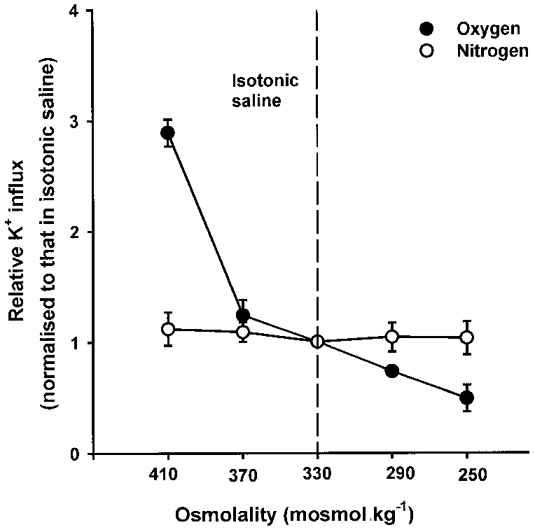
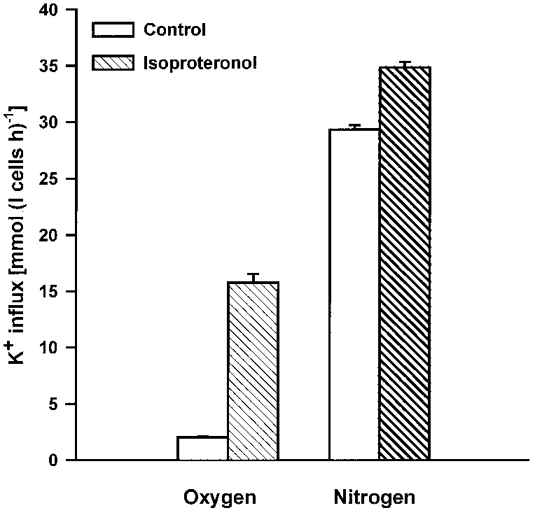
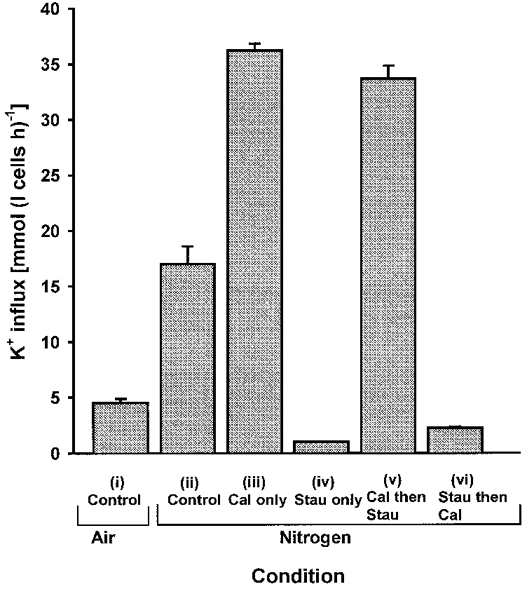
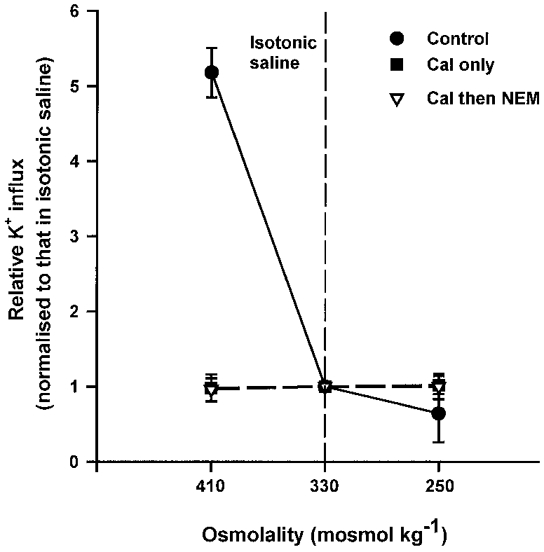
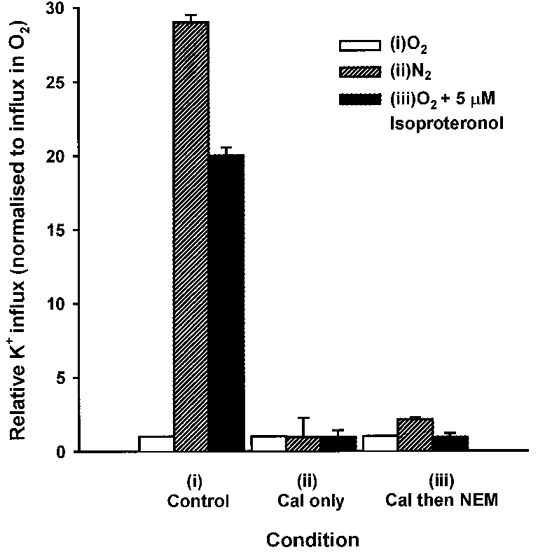
1. Na+-K+-2Cl- cotransport (NKCC) was studied in turkey red cells using Na+ dependence or bumetanide sensitivity of 86Rb+ influx to monitor activity of the transporter. 2. Deoxygenation was the major physiological stimulus for NKCC activity: oxygen tensions (PO2) over the physiological range modulated the transporter, with a PO2 for half-maximal activation of about 41 mmHg (n = 3). In air, activity of NKCC was also stimulated by shrinkage and isoproteronol (isoprenaline, 5 microgr;M). By contrast, in deoxygenated cells, although the transporter activity was markedly elevated, it was no longer sensitive to volume or beta-adrenergic stimulation. 3. Calyculin A, a protein phosphatase inhibitor, stimulated cotransport with a lag of about 5 min. N-Ethylmaleimide (NEM) inhibited cotransport and also blocked the stimulatory effect of calyculin A if administered before calyculin A. Stimulation by calyculin A and deoxygenation were not additive. Staurosporine (2 microM) inhibited deoxygenated-stimulated K+ influxes, but not those stimulated by calyculin A. NEM added during calyculin A stimulation, i.e. during the 5 min lag, caused transport activity to be clamped at levels intermediate between maximal (calyculin A alone) and control. Cells treated with calyculin A alone or with calyculin A followed by NEM were no longer sensitive to volume, isoproteronol or PO2. 4. The results have characterized the interaction between deoxygenation and other stimuli of NKCC activity. They have also shown that it is possible to manipulate the transporter in a reciprocal way to that shown previously for K+-Cl- cotransport.
Figures
Similar articles
-
Regulation of Na+-K+-2Cl- cotransport by protein phosphorylation in ferret erythrocytes.J Physiol. 1999 Jun 15;517 ( Pt 3)(Pt 3):699-708. doi: 10.1111/j.1469-7793.1999.0699s.x. J Physiol. 1999. PMID: 10358111 Free PMC article.
-
Regulation of potassium transport in human lens epithelial cells.Exp Eye Res. 2006 Jan;82(1):55-64. doi: 10.1016/j.exer.2005.05.002. Epub 2005 Jul 5. Exp Eye Res. 2006. PMID: 16002066
-
Down-regulation of Na-K-Cl cotransport by protein kinase C is mediated by protein phosphatase 1 in pigmented ciliary epithelial cells.Exp Eye Res. 2001 Apr;72(4):371-9. doi: 10.1006/exer.2000.0966. Exp Eye Res. 2001. PMID: 11273665
-
Regulation of Na-K-2Cl cotransport by phosphorylation and protein-protein interactions.Biochim Biophys Acta. 2002 Nov 13;1566(1-2):140-51. doi: 10.1016/s0005-2736(02)00586-2. Biochim Biophys Acta. 2002. PMID: 12421545 Review.
-
Volume-sensitive transport systems and volume homeostasis in vertebrate red blood cells.J Exp Biol. 1997 Jan;200(Pt 2):343-52. doi: 10.1242/jeb.200.2.343. J Exp Biol. 1997. PMID: 9050243 Review.
Cited by
-
Effect of intracellular magnesium and oxygen tension on K+-Cl- cotransport in normal and sickle human red cells.Cell Physiol Biochem. 2006;17(3-4):121-8. doi: 10.1159/000092073. Epub 2006 Mar 14. Cell Physiol Biochem. 2006. PMID: 16543728 Free PMC article.
-
Characterization of SPAK and OSR1, regulatory kinases of the Na-K-2Cl cotransporter.Mol Cell Biol. 2006 Jan;26(2):689-98. doi: 10.1128/MCB.26.2.689-698.2006. Mol Cell Biol. 2006. PMID: 16382158 Free PMC article.
-
Regulation of erythrocyte Na+/K+/2Cl- cotransport by an oxygen-switched kinase cascade.J Biol Chem. 2019 Feb 15;294(7):2519-2528. doi: 10.1074/jbc.RA118.006393. Epub 2018 Dec 18. J Biol Chem. 2019. PMID: 30563844 Free PMC article.
-
Activation of ferret erythrocyte Na+-K+-2Cl- cotransport by deoxygenation.J Physiol. 2005 Mar 1;563(Pt 2):421-31. doi: 10.1113/jphysiol.2004.080507. Epub 2004 Dec 23. J Physiol. 2005. PMID: 15618270 Free PMC article.
-
The biogenesis of potassium transporters: implications of disease-associated mutations.Crit Rev Biochem Mol Biol. 2024 Jun-Aug;59(3-4):154-198. doi: 10.1080/10409238.2024.2369986. Epub 2024 Jul 1. Crit Rev Biochem Mol Biol. 2024. PMID: 38946646 Free PMC article. Review.
References
-
- Alper SL, Palfrey HC, DeReimer SA, Greengard P. Hormonal control of protein phosphorylation in turkey erythrocytes. Journal of Biological Chemistry. 1980;255:11029–11039. - PubMed
-
- Borgese F, Motais R, Garcia-Romeu F. Regulation of Cl-dependent K transport by oxy-deoxyhemoglobin transitions in trout red cells. Biochimica et Biophysica Acta. 1991;1066:252–256. - PubMed
-
- Canessa M, Fabry ME, Nagel RL. Deoxygenation inhibits the volume-stimulated Cl−-dependent K efflux in SS and young AA cells: a cytoplasmic Mg2+ modulation. Blood. 1987;70:1861–1866. - PubMed
-
- Chipperfield AR. The (Na+-K+-Cl−) co-transport system. Clinical Science. 1986;71:465–476. - PubMed
Publication types
MeSH terms
Substances
Grants and funding
LinkOut - more resources
Full Text Sources