. 1999 Jun 1;517 ( Pt 2)(Pt 2):563-73.
doi: 10.1111/j.1469-7793.1999.0563t.x.

Regenerative potentials evoked in circular smooth muscle of the antral region of guinea-pig stomach

Affiliations

Regenerative potentials evoked in circular smooth muscle of the antral region of guinea-pig stomach

H Suzuki et al. J Physiol. .

Abstract

1. Slow waves recorded from the circular smooth muscle layer of guinea-pig antrum consisted of two components, an initial component and a secondary regenerative component. Whereas both components persisted in the presence of nifedipine, the secondary component was abolished by a low concentration of caffeine. 2. Short segments of single bundles of circular muscle were isolated and impaled with two microelectrodes. Depolarizing currents initiated regenerative responses which resembled those initiated during normal slow waves. These responses had partial refractory periods of 20-30 s and were initiated about 1 s after the onset of membrane depolarization. 3. The regenerative responses persisted in the presence of either nifedipine or cobalt ions but were abolished by caffeine, BAPTA or cyclopiazonic acid. 4. The observations suggest that depolarizing membrane potential changes trigger the release of Ca2+ from intracellular stores and this causes a depolarization by activating sets of unidentified ion channels in the membranes of smooth muscle cells of the circular layer of guinea-pig antrum.


Figures

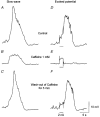
Figure 1
Figure 1. Effect of nifedipine and caffeine on slow waves and associated contractions recorded from the antral region of guinea-pig stomach
A, recordings of a slow wave (upper trace) and associated contraction (lower trace) recorded in control solution. B, recordings from the same cell some 15 min after adding nifedipine (1 μm) to the physiological saline. It can be seen that the slow wave was little changed but the amplitude of the associated contraction was much reduced. C, recordings obtained from the same cell, 1 min after adding caffeine (1 mM) to the physiological saline. It can be seen that both the secondary component of the slow wave and the remaining contraction were abolished. The force calibration applies to each contraction record, the voltage calibration applies to each voltage record. The time calibration refers to all recordings.
Figure 2
Figure 2. Effect of caffeine on regenerative potentials triggered during a slow wave and by depolarizing a single bundle of circular smooth muscle of guinea-pig stomach
A-C, slow waves recorded from a single bundle of circular muscle with the longitudinal muscle layer remaining attached. D-F, regenerative potentials triggered in a single bundle of circular muscle which lacked the longitudinal muscle layer. The secondary component of the slow wave (A) was abolished by caffeine (1 mM, B) and returned after washing out the caffeine (C). Similarly the regenerative potentials (D), initiated by passing current (2 nA for 2 s, indicated by bars) through a second intracellular electrode, were abolished by caffeine (1 mM, E) and restored by washing out caffeine (F). The time and voltage calibrations apply to all traces.
Figure 3
Figure 3. Regenerative potentials evoked in a single bundle of circular muscle from the antral region of guinea-pig stomach
The superimposed upper pair of traces show regenerative potentials triggered by passing depolarizing and hyperpolarizing current pulses (lower traces) through the second intracellular electrode. Note the regenerative potentials had similar amplitudes when initiated by a current of either polarity.
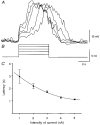
Figure 7
Figure 7. Effect of applying different hyperpolarizing stimuli on latency of regenerative potentials evoked in a single bundle of circular muscle from the antral region of guinea-pig stomach
A, superimposed traces of selected responses triggered by hyperpolarizing current pulses of increasing intensity. The intensities of the applied currents were -1, -2, -3, -4 and -5 nA (B). The time calibration applies to all traces. C shows the relationship between current strength and mean latency. Each point is the mean of 10 determinations from a single preparation, the error bars represent ± 1 s.e.m. Note that the latency decreases with increased strength towards a minimum of about 3 s.
Figure 4
Figure 4. Effect of stimulus strength on regenerative potentials evoked in a single bundle of circular muscle from the antral region of guinea-pig stomach
Each set of superimposed traces shows successive potentials triggered by passing depolarizing current pulses (indicated by bars) through a second intracellular electrode. The current intensities were 1 (A), 2 (B) and 3 nA (C). Note that the threshold stimulus in A failed to trigger a regenerative potential on one occasion, but, when triggered, the potentials were of similar amplitudes irrespective of current magnitude. Doubling the stimulus strength (B) produced no further increase in amplitude of the responses. Increasing the stimulus strength further (C) dramatically reduced the variability of latency of the responses but did not abolish their long latency completely. The voltage and time calibrations apply to all traces.
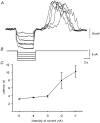
Figure 5
Figure 5. Effect of stimulus strength on latency of regenerative potentials evoked in a single bundle of circular muscle from the antral region of guinea-pig stomach
A, superimposed traces of selected potentials triggered by depolarizing current pulses of increasing intensity. The intensities of the applied currents were +1, +2, +3, +4 and +5 nA (B). The time calibration applies to all traces. C shows the relationship between current strength and mean latency. Each point is the mean of 10 determinations from a single preparation, the error bars represent ± 1 s.e.m. Note that although the latency decreases with increased strength it approaches a minimum value in this preparation of about 1 s.
Figure 6
Figure 6. Initiation of regenerative potentials in a single bundle of circular muscle by different stimuli
A, a regenerative potential triggered by a 2 nA depolarizing current pulse lasting for 5 s. B, a regenerative potential triggered by a 4 nA depolarizing current pulse lasting for 1 s. Note that although the membrane potential initially returned to its resting value, the shorter current pulse continued to initiate a regenerative potential. The voltage, current and time calibrations apply to all traces.
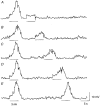
Figure 8
Figure 8. Refractory period of regenerative potentials evoked in a single bundle of circular muscle from the antral region of guinea-pig stomach
The traces show regenerative potentials initiated by a pair of stimuli of constant strength (3 nA) and constant duration (5 s) (indicated by bars) applied at varying intervals (A, 5 s; B, 10 s; C, 15 s; D, 20 s; E, 25 s). Note that with a short separation (A), the second stimulus failed to trigger a response. As the separation was increased the regenerative potentials gradually reappeared, albeit with slower rising phases (B-D). With a longer separation responses of equal amplitude were initiated (E). The voltage and time calibrations apply to all traces.
Figure 9
Figure 9. Effect of Co2+ and CPA on regenerative potentials triggered in single bundles of circular smooth muscle of guinea-pig stomach
A and B, regenerative potentials triggered by 2 nA of depolarizing current (indicated by bars) in control solution and 30 min after adding Co2+ (0.3 mM), respectively. C-E, recorded from another preparation, regenerative potentials triggered by 4 nA current pulses (indicated by bars). The regenerative potential (C) was abolished some 15 min after adding CPA (30 μm) to the physiological saline (D). The potential was restored after washing with drug-free solution for 30 min (E). The voltage and time calibrations apply to all traces.
Figure 10
Figure 10. Effect of BAPTA on regenerative potentials triggered in single bundles of circular smooth muscle of guinea-pig stomach
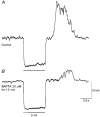
A, regenerative potential triggered by a 3 nA hyperpolarizing current pulse. B, the preparation was superfused with a solution containing BAPTA AM (20 μm) for 15 min and then washed with drug-free solution for a further 10 min. Hyperpolarizing current pulses triggered regenerative potentials of reduced amplitude. Washing the preparation with drug-free solution for several hours failed to restore the potentials. The voltage and time calibrations apply to both traces.

Similar articles

Cited by

References

    1. Abe Y, Tomita T. Cable properties of smooth muscle. The Journal of Physiology. 1968;196:87–100. - PMC - PubMed
    1. Bramich NJ, Hirst GDS. Sympathetic neuroeffector transmission in the rat anococcygeus muscle. The Journal of Physiology. 1999;516:101–115. - PMC - PubMed
    1. Burns AJ, Herbert TM, Ward SM, Sanders KM. Interstitial cells of Cajal in the guinea-pig gastrointestinal tract as revealed by c-Kit immunohistochemistry. Cell and Tissue Research. 1997;290:11–20. - PubMed
    1. Connor JA, Prosser CL, Weems WA. A study of pace-maker activity in intestinal smooth muscle. The Journal of Physiology. 1974;240:671–701. - PMC - PubMed
    1. Cousins HM, Edwards FR, Hirst GDS, Wendt IR. Cholinergic neuromuscular transmission in the longitudinal muscle of the guinea-pig ileum. The Journal of Physiology. 1993;471:61–86. - PMC - PubMed

Publication types

MeSH terms

LinkOut - more resources