

Mapping of regional myocardial strain and work during ventricular pacing: experimental study using magnetic resonance imaging tagging
- PMID: 10334450
- PMCID: PMC2041911
- DOI: 10.1016/s0735-1097(99)00068-6
Mapping of regional myocardial strain and work during ventricular pacing: experimental study using magnetic resonance imaging tagging
Abstract
Objectives: The purpose of this study was to determine the spatial distribution of myocardial function (myofiber shortening and work) within the left ventricular (LV) wall during ventricular pacing.
Background: Asynchronous electrical activation, as induced by ventricular pacing, causes various abnormalities in LV function, perfusion and structure. These derangements may be caused by abnormalities in regional contraction patterns. However, insight into these patterns during pacing is as yet limited.
Methods: In seven anesthetized dogs, high spatial and temporal resolution magnetic resonance-tagged images were acquired in three orthogonal planes. Three-dimensional deformation data and LV cavity pressure and volume were used to determine midwall circumferential strain and external and total mechanical work at 192 sites around the left ventricle.
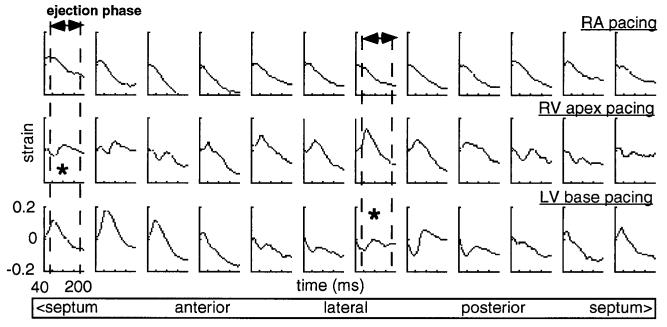
Results: During ventricular pacing, systolic fiber strain and external work were approximately zero in regions near the pacing site, and gradually increased to more than twice the normal value in the most remote regions. Total mechanical work, normalized to the value during right atrial pacing, was 38 +/- 13% (right ventricular apex [RVapex] pacing) and 61 +/- 23% (left ventricular base [LVbase] pacing) close to the pacing site, and 125 +/- 48% and 171 +/- 60% in remote regions, respectively (p < 0.05 between RVapex and LVbase pacing). The number of regions with reduced work was significantly larger during RVapex than during LVbase pacing. This was associated with a reduction of global LV pump function during RVapex pacing.
Conclusions: Ventricular pacing causes a threefold difference in myofiber work within the LV wall. This difference appears large enough to regard local myocardial function as an important determinant for abnormalities in perfusion, metabolism, structure and pump function during asynchronous electrical activation. Pacing at sites that cause more synchronous activation may limit the occurrence of such derangements.
Figures


Similar articles
-
Mapping propagation of mechanical activation in the paced heart with MRI tagging.Am J Physiol. 1999 Mar;276(3):H881-91. doi: 10.1152/ajpheart.1999.276.3.H881. Am J Physiol. 1999. PMID: 10070071
-
Timing of depolarization and contraction in the paced canine left ventricle: model and experiment.J Cardiovasc Electrophysiol. 2003 Oct;14(10 Suppl):S188-95. doi: 10.1046/j.1540.8167.90310.x. J Cardiovasc Electrophysiol. 2003. PMID: 14760923
-
Relation between the pacing induced sequence of activation and left ventricular pump function in animals.Pacing Clin Electrophysiol. 2002 Apr;25(4 Pt 1):484-98. doi: 10.1046/j.1460-9592.2002.00484.x. Pacing Clin Electrophysiol. 2002. PMID: 11991375 Review.
-
Electromechanics of paced left ventricle simulated by straightforward mathematical model: comparison with experiments.Am J Physiol Heart Circ Physiol. 2005 Nov;289(5):H1889-97. doi: 10.1152/ajpheart.00340.2005. Epub 2005 Jun 17. Am J Physiol Heart Circ Physiol. 2005. PMID: 15964924 Free PMC article.
-
Selective pacing sites.Minerva Cardioangiol. 2015 Apr;63(2):151-60. Minerva Cardioangiol. 2015. PMID: 25711837 Review.
Cited by
-
Repolarization changes underlying long-term cardiac memory due to right ventricular pacing: noninvasive mapping with electrocardiographic imaging.Circ Arrhythm Electrophysiol. 2012 Aug 1;5(4):773-81. doi: 10.1161/CIRCEP.112.970491. Epub 2012 Jul 6. Circ Arrhythm Electrophysiol. 2012. PMID: 22772896 Free PMC article.
-
Mapping cardiac surface mechanics with structured light imaging.Am J Physiol Heart Circ Physiol. 2012 Sep 15;303(6):H712-20. doi: 10.1152/ajpheart.00269.2012. Epub 2012 Jul 13. Am J Physiol Heart Circ Physiol. 2012. PMID: 22796539 Free PMC article.
-
His Bundle Pacing: Techniques and Outcomes.Curr Cardiol Rep. 2016 Jul;18(8):76. doi: 10.1007/s11886-016-0748-3. Curr Cardiol Rep. 2016. PMID: 27315122 Review.
-
Global improvement in left ventricular performance observed with cardiac contractility modulation is the result of changes in regional contractility.Heart Fail Rev. 2001 Jan;6(1):35-44. doi: 10.1023/a:1009803224027. Heart Fail Rev. 2001. PMID: 11248766 Review. No abstract available.
-
Mechano-energetics of the asynchronous and resynchronized heart.Heart Fail Rev. 2011 May;16(3):215-24. doi: 10.1007/s10741-010-9205-3. Heart Fail Rev. 2011. PMID: 21103927 Free PMC article. Review.
References
-
- McDonald IG. Echocardiographic demonstration of abnormal motion of the interventricular septum in left bundle branch block. Circulation. 1973;48:272–80. - PubMed
-
- Frais MA, Botvinick EH, Shosa DW, et al. Phase image analysis of ventricular contraction in left and right bundle branch block. Am J Cardiol. 1982;50:95–105. - PubMed
-
- Bashore TM, Stine RA, Shaffer PB, Bush CA, Leier CV, Schaal SF. The non-invasive localisation of ventricular pacing sites by radionuclide phase imaging. Circulation. 1984;70:681–94. - PubMed
-
- McGowan RL, Welch TG, Zaret BL, Bryson AL, Martin ND, Flamm MD. Noninvasive myocardial imaging with potassium-43 and rubidium-81 in patients with left bundle branch block. Am J Cardiol. 1976;38:422–8. - PubMed
-
- Ono S, Nohara R, Kambara H, Okuda K, Kawai C. Regional myocardial perfusion and glucose metabolism in experimental left bundle branch block. Circulation. 1992;85:1125–31. - PubMed
Publication types
MeSH terms
Grants and funding
LinkOut - more resources
Full Text Sources
Other Literature Sources
Medical
Miscellaneous
