. 1999 Jun;67(6):2769-75.
doi: 10.1128/IAI.67.6.2769-2775.1999.

Cross-reactivity between the rheumatoid arthritis-associated motif EQKRAA and structurally related sequences found in Proteus mirabilis

Affiliations

Cross-reactivity between the rheumatoid arthritis-associated motif EQKRAA and structurally related sequences found in Proteus mirabilis

H Tiwana et al. Infect Immun. 1999 Jun.

Abstract

Cross-reactivity or molecular mimicry may be one of the underlying mechanisms involved in the etiopathogenesis of rheumatoid arthritis (RA). Antiserum against the RA susceptibility sequence EQKRAA was shown to bind to a similar peptide ESRRAL present in the hemolysin of the gram-negative bacterium Proteus mirabilis, and an anti-ESRRAL serum reacted with EQKRAA. There was no reactivity with either anti-EQKRAA or anti-ESRRAL to a peptide containing the EDERAA sequence which is present in HLA-DRB1*0402, an allele not associated with RA. Furthermore, the EQKRAA and ESRRAL antisera bound to a mouse fibroblast transfectant cell line (Dap.3) expressing HLA-DRB1*0401 but not to DRB1*0402. However, peptide sequences structurally related to the RA susceptibility motif LEIEKDFTTYGEE (P. mirabilis urease), VEIRAEGNRFTY (collagen type II) and DELSPETSPYVKE (collagen type XI) did not bind significantly to cell lines expressing HLA-DRB1*0401 or HLA-DRB1*0402 compared to the control peptide YASGASGASGAS. It is suggested here that molecular mimicry between HLA alleles associated with RA and P. mirabilis may be relevant in the etiopathogenesis of the disease.


Figures

FIG. 1
FIG. 1
Anti-peptide antiserum dilution response curves with ELISA. The antisera were raised against the following KLH conjugates of peptide: CKDLLEQKRAAVDTYC, CLGSISESRRALQDSQR, and CKDILEDERAAVDTYC. The binding of antisera and preimmune serum was determined by using the uncoupled peptides LGSISESRRALQDSQR (A), KDLLEQKRAAVDTYC (B), and KDILEDERAAVDTYC (C) adsorbed onto the ELISA plate. Also shown is the inhibition of binding by the indicated peptide.
FIG. 1
FIG. 1
Anti-peptide antiserum dilution response curves with ELISA. The antisera were raised against the following KLH conjugates of peptide: CKDLLEQKRAAVDTYC, CLGSISESRRALQDSQR, and CKDILEDERAAVDTYC. The binding of antisera and preimmune serum was determined by using the uncoupled peptides LGSISESRRALQDSQR (A), KDLLEQKRAAVDTYC (B), and KDILEDERAAVDTYC (C) adsorbed onto the ELISA plate. Also shown is the inhibition of binding by the indicated peptide.
FIG. 2
FIG. 2
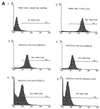
(A) Immunofluorescence profiles for 104 transfected (DR4/Dw4) Dap.3 cells with fluorescence greater than 101. Fluorescence intensity (x axis) versus cell number (y axis). Quadrant plots show binding of negative control (secondary antibody only) (panel 1), L243 (anti-DRα) (panel 2), anti-EQKRAA (panel 3), anti-ESRRAL (panel 4), anti-EDERAA (panel 5), and pooled preimmune serum (panel 6). The peptide and preimmune serum were used at a 1:160 dilution. The marker (M1) indicates the positive area of binding. (B) Dilution studies of antisera raised against CKDLLEQKRAAVDTYC, CLGSISESRRALQDSQR, and CKDILEDERAAVDTYC peptides and pooled preimmune rabbit serum binding to mouse fibroblast transfected cell line Dap.3 expressing HLA-DRB1∗0401 (DR4/Dw4). The percentages of cells which fluoresce at levels greater than the arbitrarily set level of 101 are shown. (C) Immunofluorescence profiles for 104 transfected (DR4/Dw10) Dap.3 cells with a fluorescence greater than 101. The fluorescence intensity (x axis) is plotted versus cell number (y axis). Quadrant plots show binding of anti-EDERAA (panel 1), anti-EQKRAA (panel 2), anti-ESRRAL (panel 3), and pooled preimmune serum (panel 4). The peptide and preimmune sera were used at a 1:80 dilution. The marker (M1) indicates positive area of binding. (D) Dilution studies of antisera raised to CKDLLEQKRAAVDTYC, CLGSISESRRALQDSQR, and CKDILEDERAAVDTYC peptides and pooled preimmune serum binding to the mouse fibroblast transfected cell line Dap.3 expressing HLA-DRB1∗0402 (DR4/Dw10). The percentages of cells which fluoresce at levels greater than the arbitrarily set level of 101 are shown.
FIG. 2
FIG. 2
(A) Immunofluorescence profiles for 104 transfected (DR4/Dw4) Dap.3 cells with fluorescence greater than 101. Fluorescence intensity (x axis) versus cell number (y axis). Quadrant plots show binding of negative control (secondary antibody only) (panel 1), L243 (anti-DRα) (panel 2), anti-EQKRAA (panel 3), anti-ESRRAL (panel 4), anti-EDERAA (panel 5), and pooled preimmune serum (panel 6). The peptide and preimmune serum were used at a 1:160 dilution. The marker (M1) indicates the positive area of binding. (B) Dilution studies of antisera raised against CKDLLEQKRAAVDTYC, CLGSISESRRALQDSQR, and CKDILEDERAAVDTYC peptides and pooled preimmune rabbit serum binding to mouse fibroblast transfected cell line Dap.3 expressing HLA-DRB1∗0401 (DR4/Dw4). The percentages of cells which fluoresce at levels greater than the arbitrarily set level of 101 are shown. (C) Immunofluorescence profiles for 104 transfected (DR4/Dw10) Dap.3 cells with a fluorescence greater than 101. The fluorescence intensity (x axis) is plotted versus cell number (y axis). Quadrant plots show binding of anti-EDERAA (panel 1), anti-EQKRAA (panel 2), anti-ESRRAL (panel 3), and pooled preimmune serum (panel 4). The peptide and preimmune sera were used at a 1:80 dilution. The marker (M1) indicates positive area of binding. (D) Dilution studies of antisera raised to CKDLLEQKRAAVDTYC, CLGSISESRRALQDSQR, and CKDILEDERAAVDTYC peptides and pooled preimmune serum binding to the mouse fibroblast transfected cell line Dap.3 expressing HLA-DRB1∗0402 (DR4/Dw10). The percentages of cells which fluoresce at levels greater than the arbitrarily set level of 101 are shown.

References

    1. Albani S, Tuckwell J, Esparza L, Carson D, Roudier J. The susceptibility sequence to rheumatoid arthritis is a cross-reactive B-cell epitope shared by the Escherichia coli heat shock protein dnaJ and the histocompatibility leucocyte antigen DRB10401 molecule. J Clin Investig. 1992;89:327–331. - PMC - PubMed
    1. Barber L D, Bal V, Lamb J R, O’Hehir R E, Yendle J, Hancock R J T, Lechler R I. Contribution of T-cell receptor-contacting and peptide-binding residues of the class II molecule HLA-DR4 Dw10 to serologic and antigen-specific T-cell recognition. Hum Immunol. 1991;32:110–118. - PubMed
    1. Deighton C M, Gray J, Bint A J, Walker D J. Specificity of the Proteus antibody response in rheumatoid arthritis. Ann Rheum Dis. 1992;51:1206–1207. - PMC - PubMed
    1. Dybwad A, Forre O, Sioud M. Increased serum and synovial fluid antibodies to immunoselected peptides in patients with rheumatoid arthritis. Ann Rheum Dis. 1996;55:437–441. - PMC - PubMed
    1. Ebringer A, Ptaszynska T, Corbett M, Wilson C, Macafee Y, Avakian H, Baron P, James D C O. Antibodies to Proteus in rheumatoid arthritis. Lancet. 1985;ii:305–307. - PubMed

Publication types