

Femtosecond dynamics of DNA-mediated electron transfer
- PMID: 10339533
- PMCID: PMC26827
- DOI: 10.1073/pnas.96.11.6014
Femtosecond dynamics of DNA-mediated electron transfer
Abstract
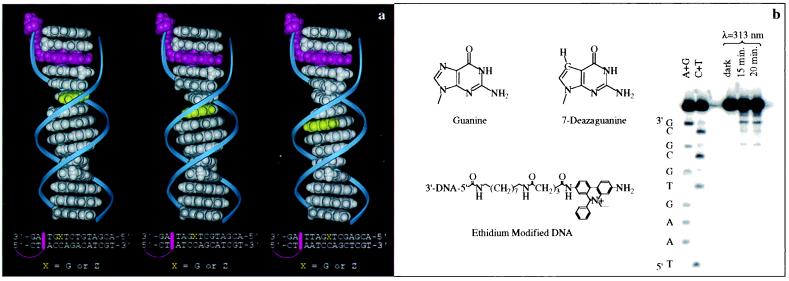
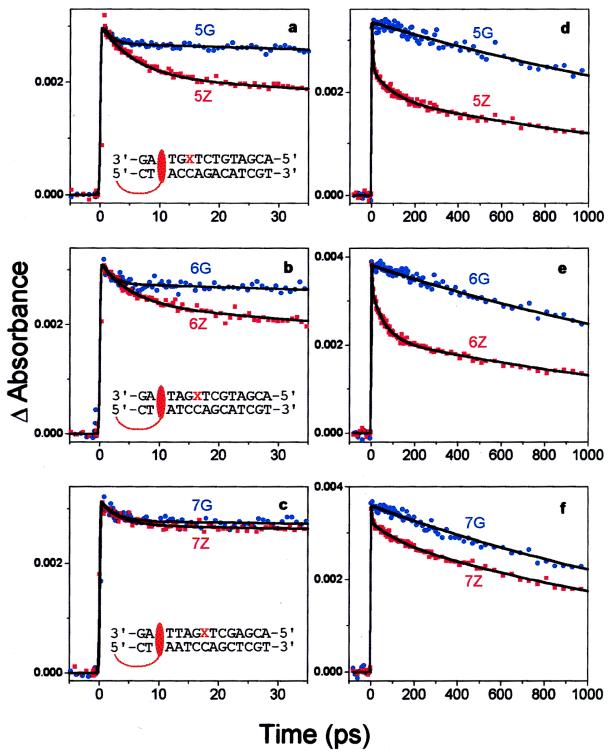
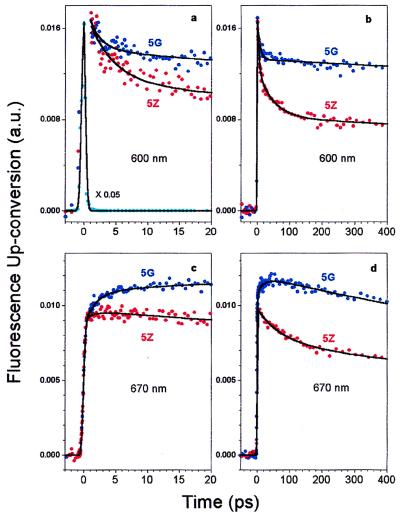
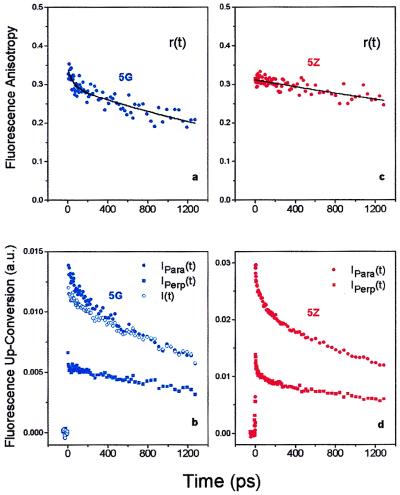
Diverse biophysical and biochemical studies have sought to understand electron transfer (ET) in DNA in part because of its importance to DNA damage and its repair. However, the dynamics and mechanisms of the elementary processes of ET in this medium are not fully understood and have been heavily debated. Two fundamental issues are the distance over which charge is transported and the time-scale on which the transport through the pi-stack of the DNA base pairs may occur. With femtosecond resolution, we report direct observation in DNA of ultrafast ET, initiated by excitation of tethered ethidium (E), the intercalated electron acceptor (A); the electron donor (D) is 7-deazaguanine (Z), a modified base, placed at different, fixed distances from A. The ultrafast ET between these reactants in DNA has been observed with time constants of 5 ps and 75 ps and was found to be essentially independent of the D-A separation (10-17 A). However, the ET efficiency does depend on the D-A distance. The 5-ps decay corresponds to direct ET observed from 7-deazaguanine but not guanine to E. From measurements of orientation anisotropies, we conclude that the slower 75-ps process requires the reorientation of E before ET, similar to E/nucleotide complexes in water. These results reveal the nature of ultrafast ET and its mechanism: in DNA, ET cannot be described as in proteins simply by a phenomenological parameter, beta. Instead, the involvement of the base pairs controls the time scale and the degree of coherent transport.
Figures
References
-
- Eley D D, Spivey D I. Faraday Soc Trans. 1962;58:411–415.
-
- Hoffmann T A, Ladik J. Adv Chem Phys. 1964;7:84–158.
-
- Okata Y, Kobayashi T, Tanaka K, Shimomura M. J Am Chem Soc. 1998;120:6165–6166.
-
- Snart R S. Biopolymers. 1968;6:293–297. - PubMed
-
- Burrows C J, Muller J G. Chem Rev. 1998;98:1109–1151. - PubMed
Publication types
MeSH terms
Substances
LinkOut - more resources
Full Text Sources
Research Materials
Miscellaneous
