. 1999 May 25;96(11):6171-6.
doi: 10.1073/pnas.96.11.6171.

Thermodynamic basis of the enhanced specificity of structured DNA probes

Affiliations

Thermodynamic basis of the enhanced specificity of structured DNA probes

G Bonnet et al. Proc Natl Acad Sci U S A. .

Abstract

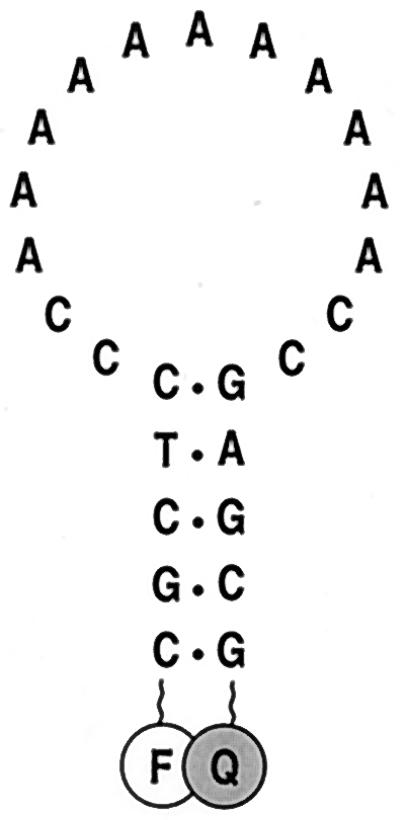
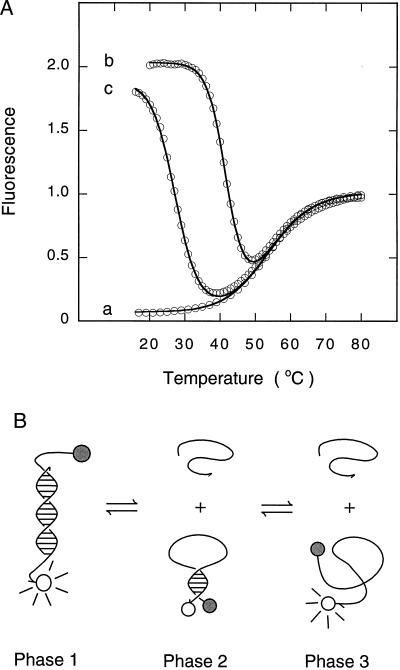
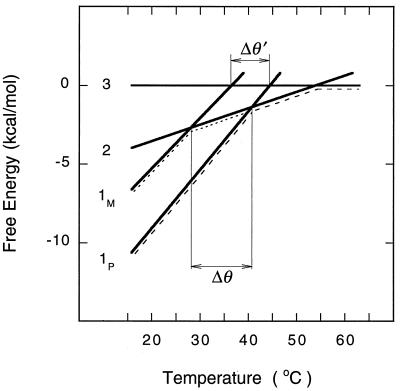
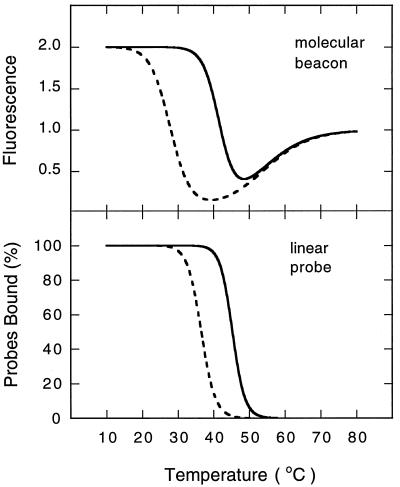
Molecular beacons are DNA probes that form a stem-and-loop structure and possess an internally quenched fluorophore. When they bind to complementary nucleic acids, they undergo a conformational transition that switches on their fluorescence. These probes recognize their targets with higher specificity than probes that cannot form a hairpin stem, and they easily discriminate targets that differ from one another by only a single nucleotide. Our results show that molecular beacons can exist in three different states: bound to a target, free in the form of a hairpin structure, and free in the form of a random coil. Thermodynamic analysis of the transitions between these states reveals that enhanced specificity is a general feature of conformationally constrained probes.


Figures

Figure 1
Figure 1
Schematic representation of the molecular beacon used in these experiments. The molecule has an oligoadenosine probe sequence embedded within complementary arm sequences. The arms form a hairpin stem and the probe sequence is located in the hairpin loop. A fluorophore (F) is covalently linked to the end of one arm and a quencher (Q) is covalently linked to the end of the other arm.
Figure 2
Figure 2
Phase transitions in solutions containing molecular beacons. (A) Thermal denaturation profiles of solutions containing molecular beacons: trace a, in the absence of targets; trace b, in the presence of a 6-fold excess of perfectly complementary targets; and trace c, in the presence of a 6-fold excess of mismatched targets. The data were fitted to Eq. 3 and plotted as continuous lines. (B) Schematic representation of the phases. As the temperature is raised, the fluorescent probe–target duplex (phase 1) dissociates into a nonfluorescent molecular beacon in a closed conformation and a randomly coiled target oligonucleotide (phase 2). As the temperature is raised even higher, the hairpin stem of the molecular beacon unravels into a fluorescent randomly coiled oligonucleotide (phase 3).
Figure 3
Figure 3
Determination of thermodynamic parameters. (A) The increase in fluorescence that accompanies the melting of the molecular beacon’s hairpin stem was used to determine the thermodynamic parameters that describe this transition. The slope of the fitted line is equal to the negative value of the enthalpy (−ΔH°2→3) and the intercept is equal to the entropy (ΔS°2→3). (B) The increase in the melting temperature of the probe–target duplex that results from increasing the concentration of target oligonucleotides was used to determine the thermodynamic parameters that describe the dissociation of probe–target duplexes. Separate determinations were carried out with perfectly complementary duplexes (●) and with mismatched duplexes (○). The slope of each fitted line is equal to the negative value of the enthalpy (−ΔH°1→2) and the intercept is equal to the entropy (ΔS°1→2). In this graph, the independent variable, R ln(T0 − 0.5B0), is plotted on the ordinate and the dependent variable, 1/θm, is plotted on the abscissa, to illustrate the similarities in the manner in which the enthalpies and entropies were determined for the dissociation of probe–target duplexes and for the dissociation of hairpin stems.
Figure 3
Figure 3
Determination of thermodynamic parameters. (A) The increase in fluorescence that accompanies the melting of the molecular beacon’s hairpin stem was used to determine the thermodynamic parameters that describe this transition. The slope of the fitted line is equal to the negative value of the enthalpy (−ΔH°2→3) and the intercept is equal to the entropy (ΔS°2→3). (B) The increase in the melting temperature of the probe–target duplex that results from increasing the concentration of target oligonucleotides was used to determine the thermodynamic parameters that describe the dissociation of probe–target duplexes. Separate determinations were carried out with perfectly complementary duplexes (●) and with mismatched duplexes (○). The slope of each fitted line is equal to the negative value of the enthalpy (−ΔH°1→2) and the intercept is equal to the entropy (ΔS°1→2). In this graph, the independent variable, R ln(T0 − 0.5B0), is plotted on the ordinate and the dependent variable, 1/θm, is plotted on the abscissa, to illustrate the similarities in the manner in which the enthalpies and entropies were determined for the dissociation of probe–target duplexes and for the dissociation of hairpin stems.
Figure 4
Figure 4
Free energy of the three phases of a solution of molecular beacons in equilibrium with target oligonucleotides. Although this phase diagram was calculated for a solution containing a particular molecular beacon at 50 nM and its target at 300 nM, the relative positions of the phase lines are generally the same for all molecular beacons under all conditions. The equation of each line is ΔG = ΔH − θ ΔS, where ΔG3 = 0; ΔG2 = 0.104 θ − 34 kcal/mol; ΔG1P = 0.371 θ − 118; and ΔG1M = 0.320 θ − 99. The difference between the melting temperatures of perfectly matched duplexes (phase 1P) and mismatched duplexes (phase 1M) is greater if the probe can form a structure after dissociation (Δθ = 14°C) than it is if the probe cannot form a structure (Δθ′ = 8°C).
Figure 5
Figure 5
Comparison of the window of mismatch discrimination observed for molecular beacons with the window of discrimination predicted for the corresponding linear probes. These curves were calculated for mixtures of 50 nM probes and 300 nM targets, utilizing the thermodynamic parameters measured for molecular beacons. Continuous lines identify perfectly complementary probe–target duplexes and broken lines identify mismatched probe–target duplexes.

References

    1. Tyagi S, Kramer F R. Nat Biotechnol. 1996;14:303–308. - PubMed
    1. Abou-ela F, Koh D, Tinoco I, Jr, Martin F H. Nucleic Acids Res. 1985;13:4811–4824. - PMC - PubMed
    1. Wagner R, Debbie P, Radman M. Nucleic Acids Res. 1995;23:3944–3948. - PMC - PubMed
    1. Youil R, Kemper B W, Cotton R G H. Proc Natl Acad Sci USA. 1995;92:87–91. - PMC - PubMed
    1. Nelson N C, Hammond P W, Matsuda E, Goud A A, Becker M M. Nucleic Acids Res. 1996;24:4998–5003. - PMC - PubMed

Publication types

LinkOut - more resources