

Activation of flavin-containing oxidases underlies light-induced production of H2O2 in mammalian cells
- PMID: 10339574
- PMCID: PMC26868
- DOI: 10.1073/pnas.96.11.6255
Activation of flavin-containing oxidases underlies light-induced production of H2O2 in mammalian cells
Abstract
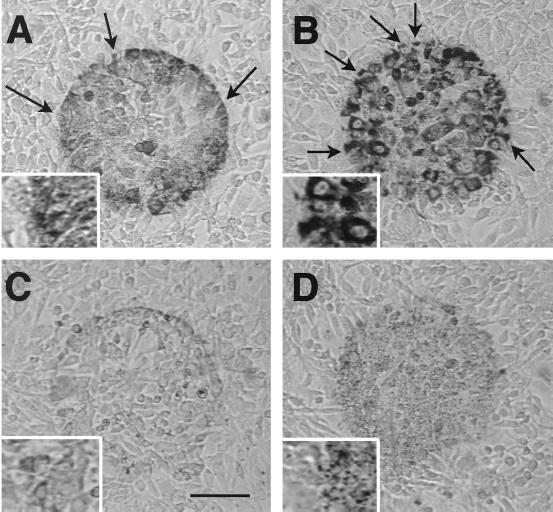
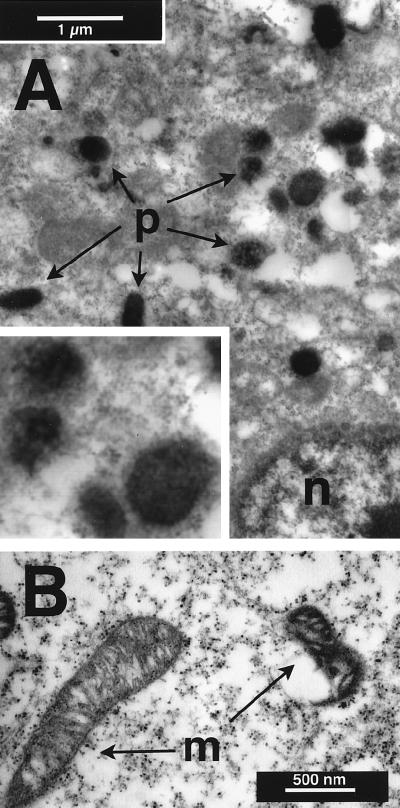
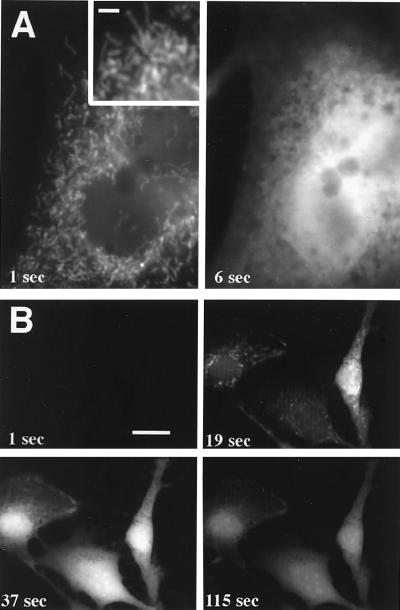
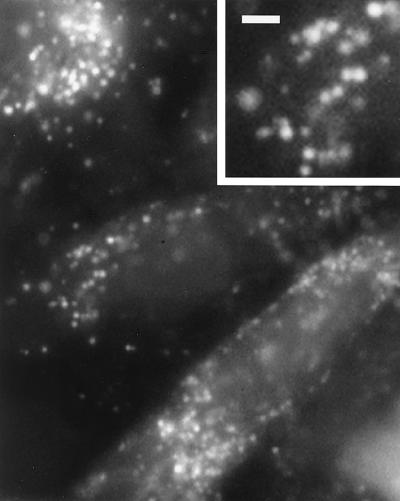
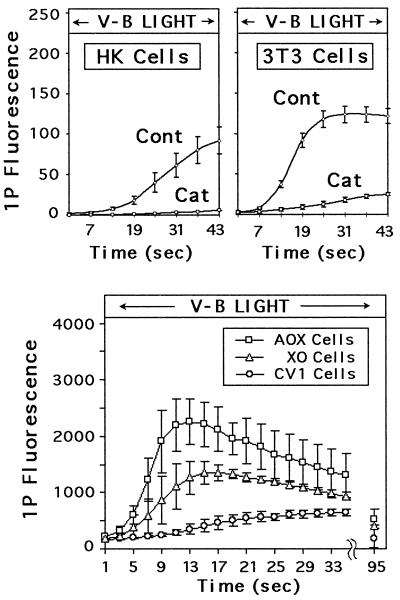
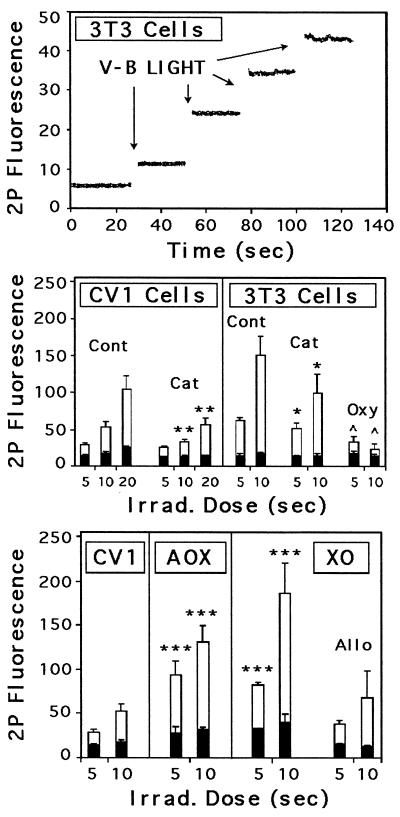
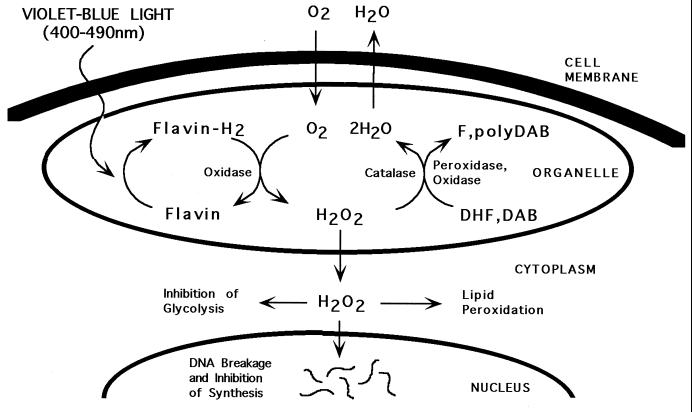
Violet-blue light is toxic to mammalian cells, and this toxicity has been linked with cellular production of H2O2. In this report, we show that violet-blue light, as well as UVA, stimulated H2O2 production in cultured mouse, monkey, and human cells. We found that H2O2 originated in peroxisomes and mitochondria, and it was enhanced in cells overexpressing flavin-containing oxidases. These results support the hypothesis that photoreduction of flavoproteins underlies light-induced production of H2O2 in cells. Because H2O2 and its metabolite, hydroxyl radicals, can cause cellular damage, these reactive oxygen species may contribute to pathologies associated with exposure to UVA, violet, and blue light. They may also contribute to phototoxicity often encountered during light microscopy. Because multiphoton excitation imaging with 1,047-nm wavelength prevented light-induced H2O2 production in cells, possibly by minimizing photoreduction of flavoproteins, this technique may be useful for decreasing phototoxicity during fluorescence microscopy.
Figures
Similar articles
-
Transformation of mammalian cells by overexpressing H2O2-generating peroxisomal fatty acyl-CoA oxidase.Proc Natl Acad Sci U S A. 1995 Jul 18;92(15):7080-4. doi: 10.1073/pnas.92.15.7080. Proc Natl Acad Sci U S A. 1995. PMID: 7624373 Free PMC article.
-
Transformation of epithelial cells stably transfected with H2O2-generating peroxisomal urate oxidase.Cancer Res. 1996 Nov 1;56(21):4846-52. Cancer Res. 1996. PMID: 8895731
-
Rose bengal-induced photodamage to subcellular membranes and enzymes.Acta Physiol Pharmacol Bulg. 1987;13(3):9-15. Acta Physiol Pharmacol Bulg. 1987. PMID: 3439477
-
Reactive oxygen species (ROS)-generating oxidases in the normal rabbit cornea and their involvement in the corneal damage evoked by UVB rays.Histol Histopathol. 2001 Apr;16(2):523-33. doi: 10.14670/HH-16.523. Histol Histopathol. 2001. PMID: 11332708
-
Protective role of intracellular superoxide dismutase against extracellular oxidants in cultured rat gastric cells.J Clin Invest. 1994 Jan;93(1):331-8. doi: 10.1172/JCI116964. J Clin Invest. 1994. PMID: 8282804 Free PMC article.
Cited by
-
Evolution shapes the responsiveness of the D-box enhancer element to light and reactive oxygen species in vertebrates.Sci Rep. 2018 Sep 4;8(1):13180. doi: 10.1038/s41598-018-31570-8. Sci Rep. 2018. PMID: 30181539 Free PMC article.
-
Mitochondrial localization of reactive oxygen species by dihydrofluorescein probes.Histochem Cell Biol. 2003 Oct;120(4):319-25. doi: 10.1007/s00418-003-0566-8. Epub 2003 Sep 20. Histochem Cell Biol. 2003. PMID: 14574587
-
Seasonal Changes in Photoperiod: Effects on Growth and Redox Signaling Patterns in Atlantic Salmon Postsmolts.Antioxidants (Basel). 2023 Aug 2;12(8):1546. doi: 10.3390/antiox12081546. Antioxidants (Basel). 2023. PMID: 37627541 Free PMC article.
-
Light based anti-infectives: ultraviolet C irradiation, photodynamic therapy, blue light, and beyond.Curr Opin Pharmacol. 2013 Oct;13(5):731-62. doi: 10.1016/j.coph.2013.08.009. Epub 2013 Sep 20. Curr Opin Pharmacol. 2013. PMID: 24060701 Free PMC article. Review.
-
Spatiotemporal distribution of reactive oxygen species production, delivery, and use in Arabidopsis root hairs.Plant Physiol. 2023 Nov 22;193(4):2337-2360. doi: 10.1093/plphys/kiad484. Plant Physiol. 2023. PMID: 37666000 Free PMC article.
References
-
- Wang R J. Photochem Photobiol. 1975;21:373–375. - PubMed
-
- Pereira O M, Smith J R, Packer L. Photochem Photobiol. 1976;24:237–242. - PubMed
-
- Tyrell R M, Werfelli P, Moraes E C. Photochem Photobiol. 1984;39:183–189. - PubMed
-
- Jones C A, Huberman E, Cunningham M L, Peak M J. Radiat Res. 1987;110:244–254. - PubMed
Publication types
MeSH terms
Substances
Grants and funding
LinkOut - more resources
Full Text Sources
Other Literature Sources
