

Induction of the Tat-binding protein 1 gene accompanies the disabling of oncogenic erbB receptor tyrosine kinases
- PMID: 10339605
- PMCID: PMC26899
- DOI: 10.1073/pnas.96.11.6434
Induction of the Tat-binding protein 1 gene accompanies the disabling of oncogenic erbB receptor tyrosine kinases
Abstract
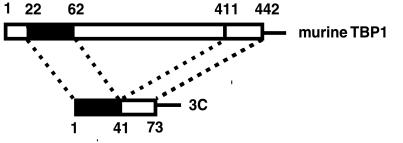
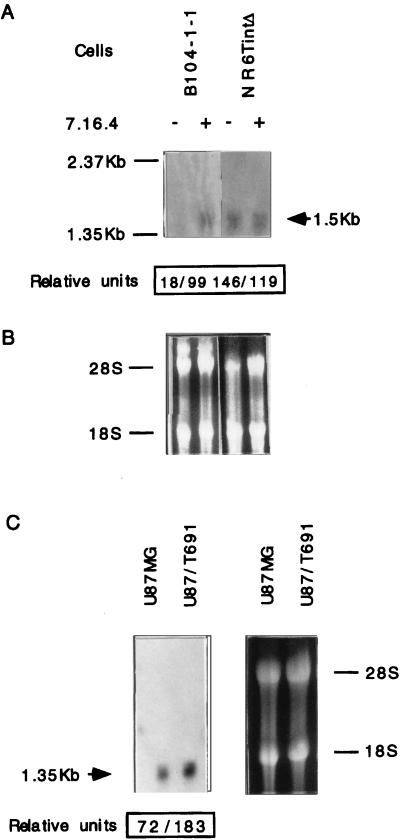
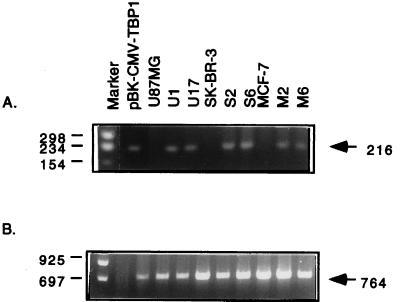
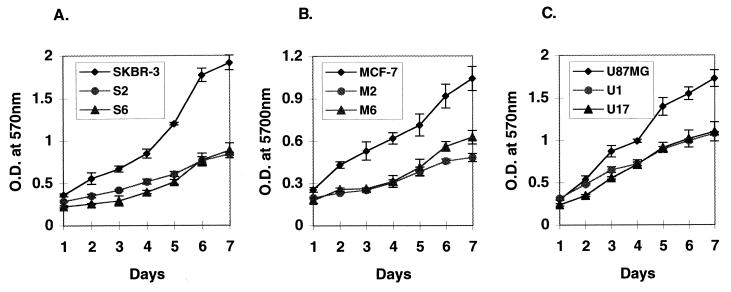
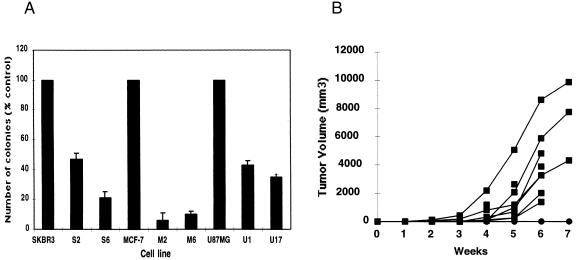
Conversion of a malignant phenotype into a more normal one can be accomplished either by down-regulation of erbB family surface receptors or by creating inactive erbB heterodimers on the cell surface. In this report, we report the identification and cloning of differentially expressed genes from antibody-treated vs. untreated fibroblasts transformed by oncogenic p185(neu). We repeatedly isolated a 325-bp cDNA fragment that, as determined by Northern analysis, was expressed at higher levels in anti-p185(neu)-treated tumor cells but not in cells expressing internalization defective p185(neu) receptors. This cDNA fragment was identical in amino acid sequence to the recently cloned mouse Tat binding protein-1 (mTBP1), which has 98.4% homology to the HIV tat-binding protein-1 (TBP1). TBP1 mRNA levels were found to be elevated on inhibition of the oncogenic phenotype of transformed cells expressing erbB family receptors. TBP1 overexpression diminished cell proliferation, reduced the ability of the parental cells to form colonies in vitro, and almost completely inhibited transforming efficiency in athymic mice when stably expressed in human tumor cells containing erbB family receptors. Collectively, these results suggest that the attenuation of erbB receptor signaling seems to be associated with activation/induction or recovery of a functional tumor suppressor-like gene, TBP1. Disabling erbB tyrosine kinases by antibodies or by trans-inhibition represents an initial step in triggering a TBP1 pathway.
Figures
Similar articles
-
Sustained mitogen-activated protein kinase activation is induced by transforming erbB receptor complexes.DNA Cell Biol. 1999 Oct;18(10):731-41. doi: 10.1089/104454999314872. DNA Cell Biol. 1999. PMID: 10541432
-
LAR-PTPase cDNA transfection suppression of tumor growth of neu oncogene-transformed human breast carcinoma cells.Mol Carcinog. 1995 Oct;14(2):103-10. doi: 10.1002/mc.2940140206. Mol Carcinog. 1995. PMID: 7576097
-
Enhanced c-erbB-2/neu expression in human ovarian cancer cells correlates with more severe malignancy that can be suppressed by E1A.Cancer Res. 1993 Feb 15;53(4):891-8. Cancer Res. 1993. PMID: 8094034
-
Signal transduction by the neu/erbB-2 receptor: a potential target for anti-tumor therapy.J Steroid Biochem Mol Biol. 1992 Sep;43(1-3):95-103. doi: 10.1016/0960-0760(92)90192-l. J Steroid Biochem Mol Biol. 1992. PMID: 1356018 Review.
-
Therapeutic monoclonal antibodies for the ErbB family of receptor tyrosine kinases.Cancer Biol Ther. 2003 Jul-Aug;2(4 Suppl 1):S122-6. Cancer Biol Ther. 2003. PMID: 14508089 Review.
Cited by
-
A regulatory mechanism involving TBP-1/Tat-Binding Protein 1 and Akt/PKB in the control of cell proliferation.PLoS One. 2011;6(10):e22800. doi: 10.1371/journal.pone.0022800. Epub 2011 Oct 4. PLoS One. 2011. Retraction in: PLoS One. 2019 Sep 4;14(9):e0222287. doi: 10.1371/journal.pone.0222287. PMID: 21991300 Free PMC article. Retracted.
-
Immunological inhibition of carcinogenesis.Cancer Immunol Immunother. 2004 Mar;53(3):204-16. doi: 10.1007/s00262-003-0483-7. Epub 2004 Jan 13. Cancer Immunol Immunother. 2004. PMID: 14722672 Free PMC article. Review.
References
MeSH terms
Substances
LinkOut - more resources
Full Text Sources
Other Literature Sources
Medical
Research Materials
Miscellaneous
