

Cortical auditory signal processing in poor readers
- PMID: 10339614
- PMCID: PMC26908
- DOI: 10.1073/pnas.96.11.6483
Cortical auditory signal processing in poor readers
Abstract
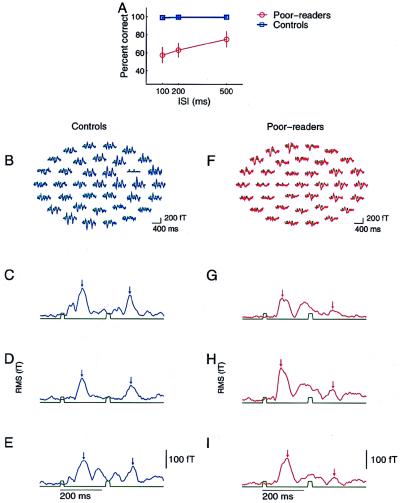
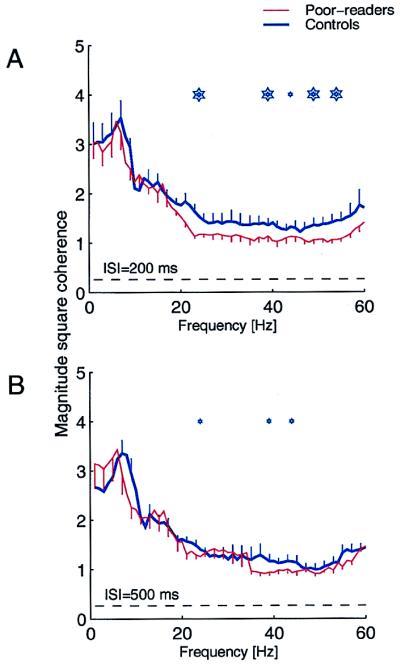
Magnetoencephalographic responses recorded from auditory cortex evoked by brief and rapidly successive stimuli differed between adults with poor vs. good reading abilities in four important ways. First, the response amplitude evoked by short-duration acoustic stimuli was stronger in the post-stimulus time range of 150-200 ms in poor readers than in normal readers. Second, response amplitude to rapidly successive and brief stimuli that were identical or that differed significantly in frequency were substantially weaker in poor readers compared with controls, for interstimulus intervals of 100 or 200 ms, but not for an interstimulus interval of 500 ms. Third, this neurological deficit closely paralleled subjects' ability to distinguish between and to reconstruct the order of presentation of those stimulus sequences. Fourth, the average distributed response coherence evoked by rapidly successive stimuli was significantly weaker in the beta- and gamma-band frequency ranges (20-60 Hz) in poor readers, compared with controls. These results provide direct electrophysiological evidence supporting the hypothesis that reading disabilities are correlated with the abnormal neural representation of brief and rapidly successive sensory inputs, manifested in this study at the entry level of the cortical auditory/aural speech representational system(s).
Figures

Similar articles
-
Abnormal cortical processing of the syllable rate of speech in poor readers.J Neurosci. 2009 Jun 17;29(24):7686-93. doi: 10.1523/JNEUROSCI.5242-08.2009. J Neurosci. 2009. PMID: 19535580 Free PMC article.
-
Cortical Auditory-Evoked Potential and Behavioral Evidence for Differences in Auditory Processing between Good and Poor Readers.J Am Acad Audiol. 2017 Jun;28(6):534-545. doi: 10.3766/jaaa.16054. J Am Acad Audiol. 2017. PMID: 28590897
-
Refractory effects on auditory-evoked responses in children with reading disorders.Neuroreport. 2007 Jan 22;18(2):133-6. doi: 10.1097/WNR.0b013e32800fef71. Neuroreport. 2007. PMID: 17301677
-
Cortical differentiation of speech and nonspeech sounds at 100 ms: implications for dyslexia.Cereb Cortex. 2005 Jul;15(7):1054-63. doi: 10.1093/cercor/bhh206. Epub 2004 Nov 24. Cereb Cortex. 2005. PMID: 15563727
-
Clinical neurophysiology of visual and auditory processing in dyslexia: a review.Clin Neurophysiol. 2010 Nov;121(11):1794-809. doi: 10.1016/j.clinph.2010.04.028. Epub 2010 May 31. Clin Neurophysiol. 2010. PMID: 20570212 Review.
Cited by
-
Reading and subcortical auditory function.Cereb Cortex. 2009 Nov;19(11):2699-707. doi: 10.1093/cercor/bhp024. Epub 2009 Mar 17. Cereb Cortex. 2009. PMID: 19293398 Free PMC article.
-
Association between lesion location and language function in adult glioma using voxel-based lesion-symptom mapping.Neuroimage Clin. 2015 Oct 23;9:617-24. doi: 10.1016/j.nicl.2015.10.010. eCollection 2015. Neuroimage Clin. 2015. PMID: 26740915 Free PMC article.
-
Sex-dependent hemispheric asymmetries for processing frequency-modulated sounds in the primary auditory cortex of the mustached bat.J Neurophysiol. 2012 Sep;108(6):1548-66. doi: 10.1152/jn.00952.2011. Epub 2012 May 30. J Neurophysiol. 2012. PMID: 22649207 Free PMC article.
-
Reduced left-lateralized pattern of event-related EEG oscillations in infants at familial risk for language and learning impairment.Neuroimage Clin. 2019;22:101778. doi: 10.1016/j.nicl.2019.101778. Epub 2019 Mar 12. Neuroimage Clin. 2019. PMID: 30901712 Free PMC article.
-
Genetics of dyslexia: the evolving landscape.J Med Genet. 2007 May;44(5):289-97. doi: 10.1136/jmg.2006.046516. Epub 2007 Feb 16. J Med Genet. 2007. PMID: 17307837 Free PMC article. Review.
References
-
- Bishop D V M. J Child Psychol Psychiatry. 1992;33:2–66. - PubMed
-
- Leonard L B. Children with Specific Language Impairment. Cambridge, Mass.: MIT Press; 1998.
-
- Reid L G. Ann Dyslexia. 1995;45:3–27.
-
- Farmer M E, Klein R M. Psychonom Bull Rev. 1995;2:460–493. - PubMed
-
- Tallal P, Galaburda A M, Llinas R R, von Euler C, editors. Temporal Information Processing in the Nervous System: Special Reference to Dyslexia and Dysplasia. New York: N.Y. Acad. Sci.; 1993. - PubMed
Publication types
MeSH terms
Grants and funding
LinkOut - more resources
Full Text Sources
Other Literature Sources
