. 1999 Jun 1;19(11):4314-24.
doi: 10.1523/JNEUROSCI.19-11-04314.1999.

A role of actin filament in synaptic transmission and long-term potentiation

Affiliations

A role of actin filament in synaptic transmission and long-term potentiation

C H Kim et al. J Neurosci. .

Abstract

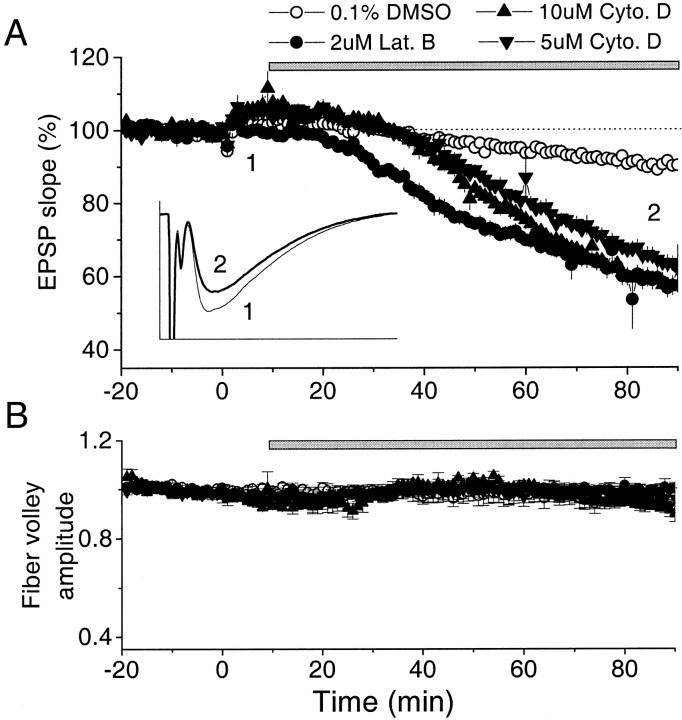
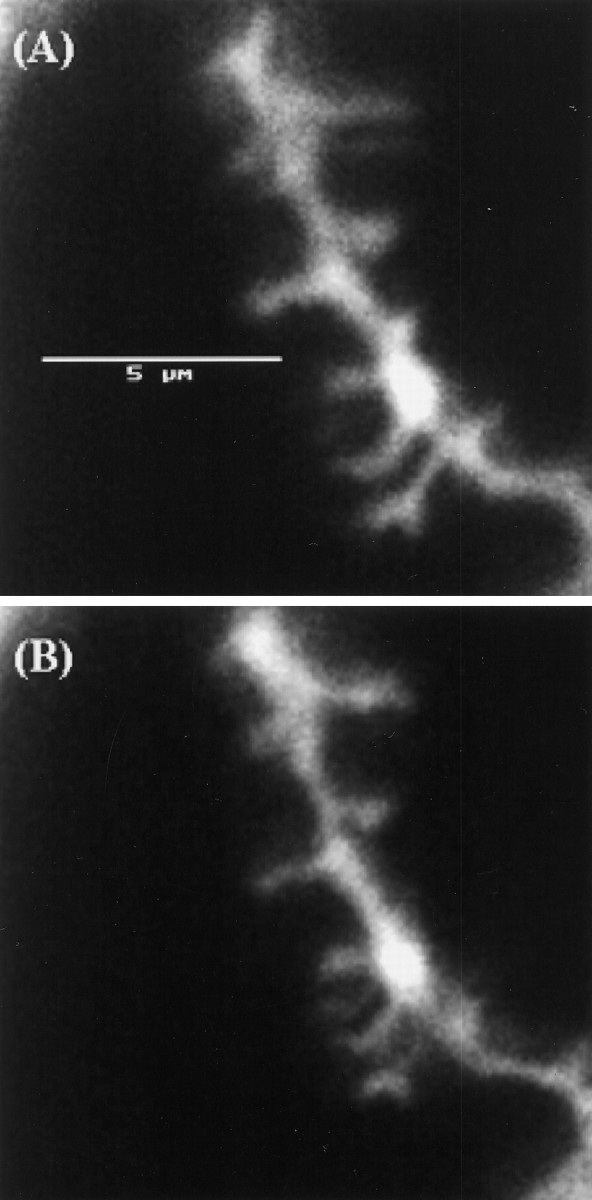
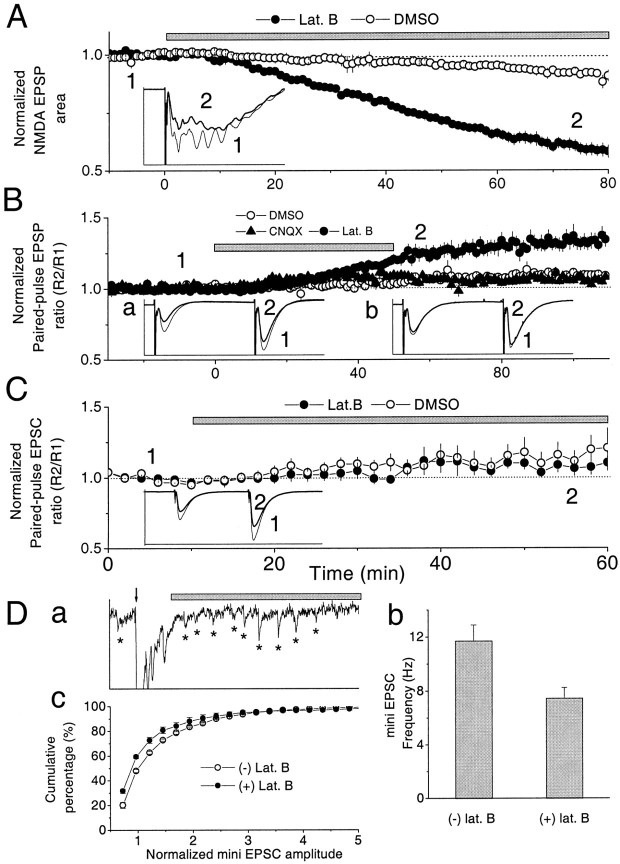
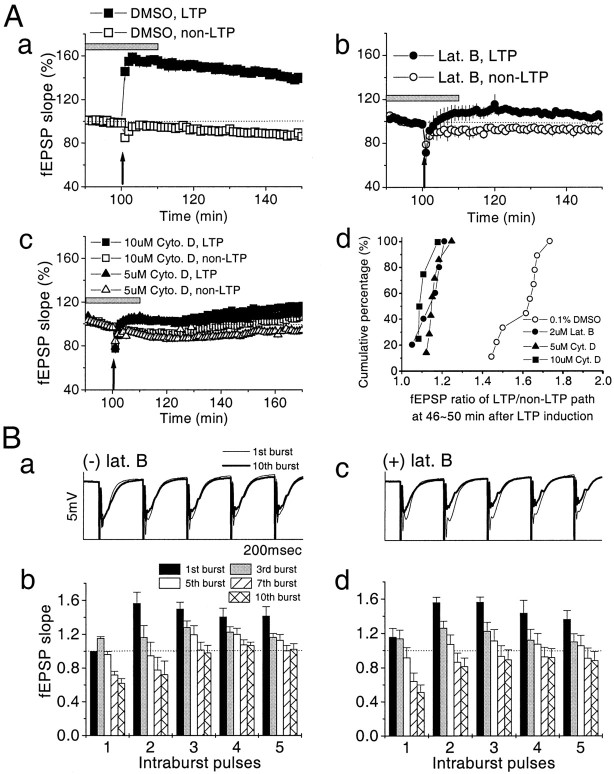
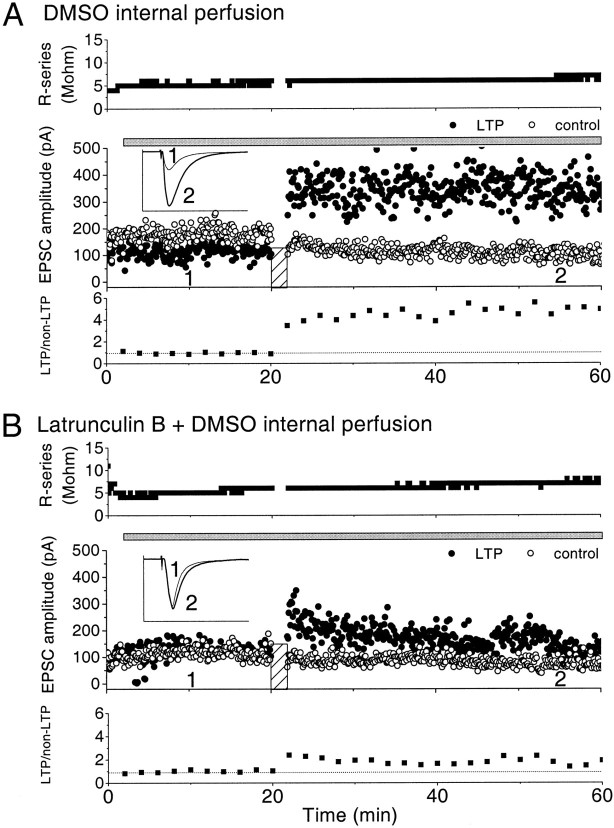
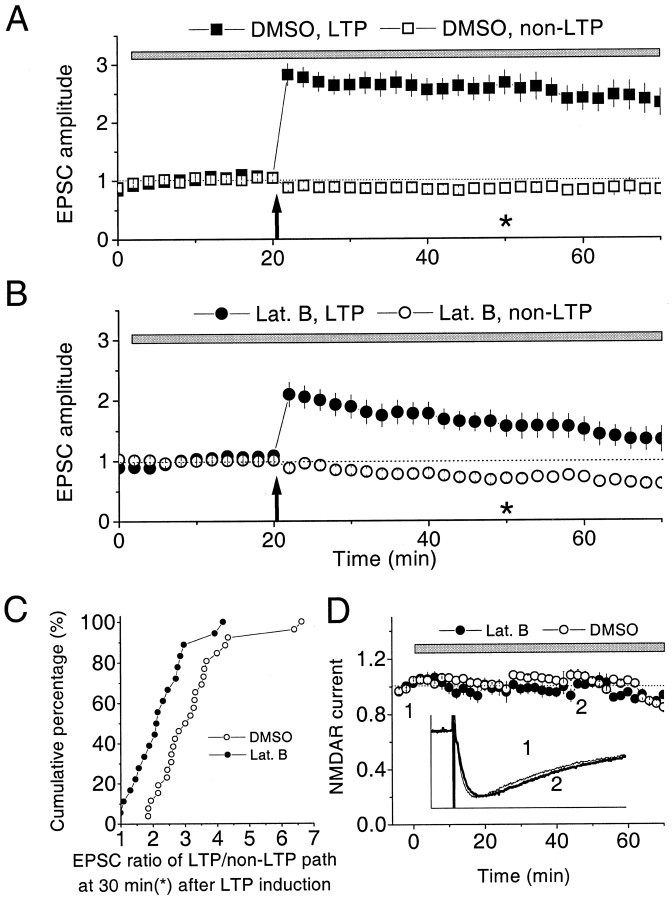
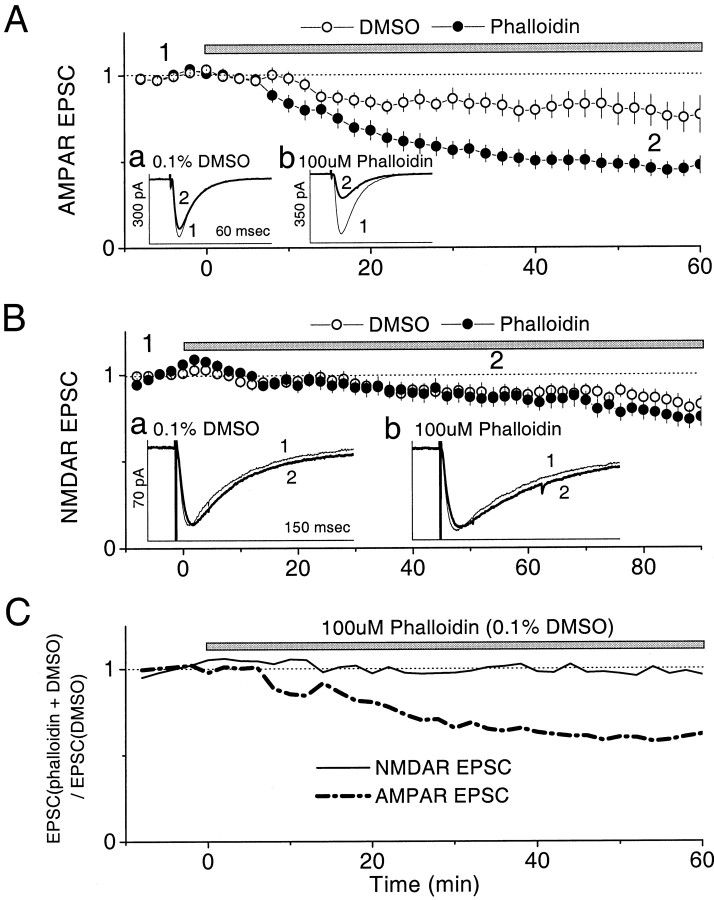
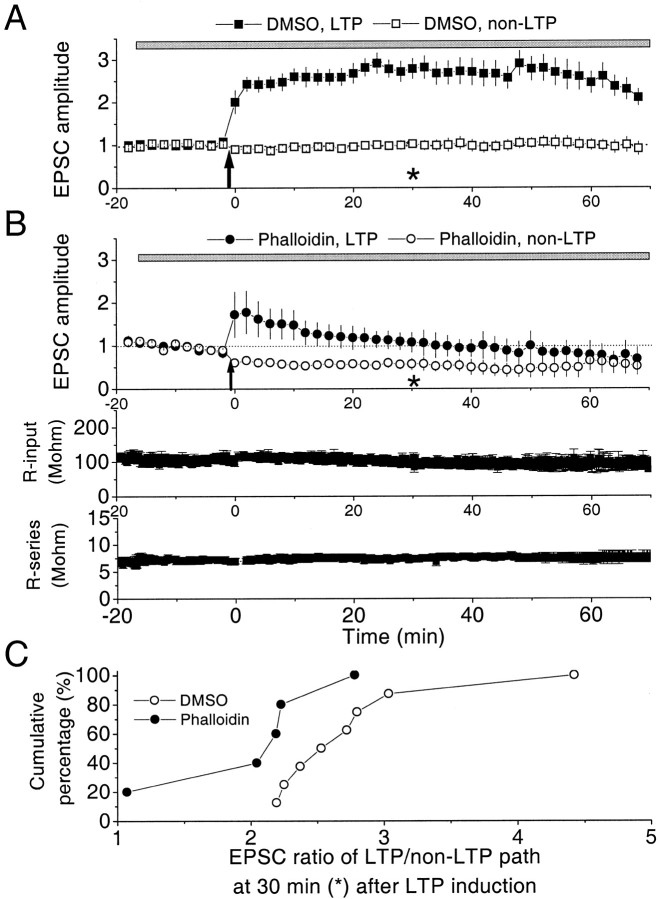
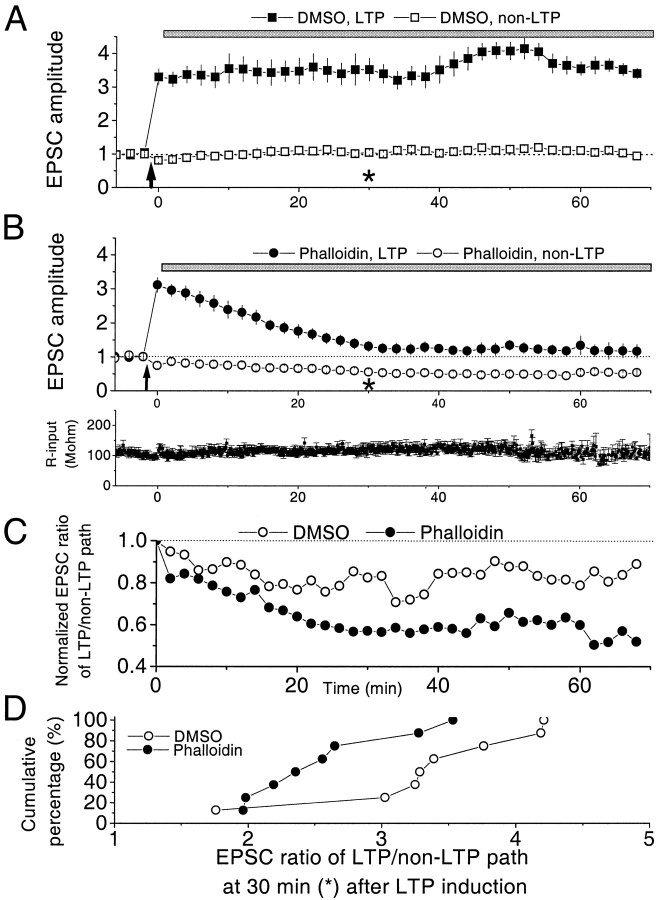
The role of actin filaments in synaptic function has been studied in the CA1 region of the rat hippocampal slice. Bath application (2 hr) of the actin polymerization inhibitor latrunculin B did not substantially affect the shape of dendrites or spines. However, this and other drugs that affect actin did affect synaptic function. Bath-applied latrunculin B reduced the synaptic response. Several lines of evidence indicate that a component of this effect is presynaptic. To specifically test for a postsynaptic role for actin, latrunculin B or phalloidin, an actin filament stabilizer, was perfused into the postsynaptic neuron. The magnitude of long-term potentiation (LTP) was decreased at times when baseline transmission was not yet affected. Longer applications produced a decrease in baseline AMPA receptor (AMPAR)-mediated transmission. The magnitude of the NMDA receptor-mediated transmission was unaffected, indicating a specific effect on the AMPAR. These results suggest that postsynaptic actin filaments are involved in a dynamic process required to maintain AMPAR-mediated transmission and to enhance it during LTP.


Figures

Fig. 1.
Fig. 1.
Bath-applied latrunculin B and cytochalasin D decrease fEPSP in CA1 region of hippocampal slice. A, Actin polymerization inhibitors latrunculin B (2 μm;n = 7) or cytochalasin D (5 μm;n = 7; 10 μm; n = 4) were applied extracellularly dissolved in 0.1% DMSO. Control solution contained 0.1% DMSO (n = 10). Thebar indicates the period of drug application. The average fEPSP in the DMSO controls, 2 μm latrunculin B, and 5 μm and 10 μm cytochalasin D experiments, measured at 70–80 min after its application, were 91, 59, 63, and 57% of the baseline, respectively. The small rise at time 0 occurred because LTP was induced in a different pathway.Inset, Examples of average traces before (thin line, 1) and after 2 μm latrunculin B application (thick line,2). Calibration: 2.5 mV, 25 msec. B, Effect of bath-applied APIs on fiber volley amplitude. The same symbols were used as in A. The effect on the amplitude of fiber volley of 0.1% DMSO ACSF (n = 7), 2 μm latrunculin B (n = 7), and cytochalasin D (5 μm; n = 7; 10 μm; n = 4) were indistinguishable, indicating no effect of APIs on presynaptic excitability.
Fig. 2.
Fig. 2.
Bath-applied latrunculin B does not abolish postsynaptic spines or dendrites. Confocal image of dendrite of CA1 pyramidal neuron labeled with DiI. Before (A) and after (B) 2 hr application of 4 μmlatrunculin B. Scale bar, 5 μm.
Fig. 3.
Fig. 3.
Experiments indicating that there is a presynaptic site of action of bath-applied latrunculin B. A, The NMDAR-mediated synaptic transmission was also reduced by latrunculin B. The area of the NMDAR-mediated fEPSP was measured with ACSF containing 0.1 mm Mg2+ in which 10 μmCNQX was used to block AMPAR-mediated synaptic transmission. Thebar indicates the period of drug application. Latrunculin B (2 μm) was applied 10 min after baseline recording (n = 6). As a control, 0.1% DMSO ACSF was used (n = 3). Inset, Average fEPSP before (thin trace, 1) and after (thick trace, 2) latrunculin B application. The spiking always appeared at this stimulation condition (0.1 mm Mg2+, 2.5 mmCa2+, 2.5 mm KCl, and 50 μm picrotoxin in ACSF, and without CA3 region in slice) and was blocked by APV (data not shown; Bortolotto and Collingridge, 1998). Calibration: 2 mV, 100 msec. B, Paired-pulse facilitation quantified by the ratio of the initial slopes of two fEPSPs at 50 msec interval. The bar indicates the duration of drug application. Latrunculin B (2 μm) was applied for 50 min after 20 min of baseline recording (n = 7). The average PPF ratios at 5–10 min after washout of DMSO control, 0.3 μm CNQX, and latrunculin B experiments were 1.07 ± 0.009, 1.06 ± 0.02, and 1.25 ± 0.03 (mean ± SE), respectively. Inset a, Examples of average responses before (thin line,1) and after (thick line,2) 2 μm latrunculin B application.Inset b, Before (thin line,1) and after (thick line,2) 0.3 μm CNQX application. Calibration: 3.5 mV, 90 msec. C, Effects of postsynaptically applied latrunculin B on PPF as measured using whole-cell recording. Thebar indicates the duration of drug application to the postsynaptic cell. Latrunculin B (100 μm) was applied after 10 min of baseline recording (n = 7). As a control, 0.2% DMSO internal solution (n = 4) was applied. The effect of latrunculin B on PPF was not significantly different from that of DMSO control 50 min after drug application (t test; p ≫ 0.05).Inset, Two example average traces before (thin line, 1) and after (thick line, 2) 100 μm latrunculin B application. Calibration: 800 pA, 120 msec. D, Effect of bath-applied 4 μm latrunculin B on evoked mEPSCs. a, An evoked EPSC trace is shown. The arrow indicates when the stimulus was given. The period marked by the gray bar was used for analysis (asterisk indicates mEPSCs). One hundred traces were acquired for each experiment. Calibration: 100 pA, 500 msec. A higher concentration of latrunculin B than in Figure 1 was used to speed the onset of the effect. b, Latrunculin B significantly reduced mEPSC frequency by 36%. c, Cumulative distribution of mEPSC amplitude. Latrunculin B reduced the average mEPSC amplitude by 9%. Amplitude was normalized to 50% of cumulative percentage in the control condition.
Fig. 4.
Fig. 4.
Bath-applied latrunculin B and cytochalasin D inhibit LTP induction. In each experiment, after 80 min of drug application, the stimulus strength was increased to produce the same level of fEPSP slope before drug application. A, LTP induction was significantly inhibited by APIs. Arrowindicates the time when the theta-burst stimulus was given. Gray bar indicates the period of the application of drug.a, LTP was induced by a theta burst in 0.1% DMSO (n = 9; filled rectangles). The magnitudes of average fEPSP of LTP and non-LTP pathways measured 50 min after LTP induction was 139 and 87% of the baseline, which gave 160% of potentiation relative to fEPSP of non-LTP path (open rectangles). b, latrunculin B (2 μm) significantly inhibited LTP (n = 8; filled circles). The average fEPSPs of LTP and non-LTP path at 50 min after induction were 104 and 92% of the baseline, which gave 113% potentiation compared with the fEPSP of non-LTP path (open circles). c, Cytochalasin D also inhibited LTP induction. Cytochalasin D at 5 (rectangles; n = 7) and 10 (triangles; n = 4) μmwere tested. The average fEPSPs of LTP (filled) and non-LTP path (open) at 50 min after induction were 111 and 101% of the baseline, which gave 110% relative potentiation in 10 μm cytochalasin D experiment. The relative potentiation at 50 min after LTP induction in 5 μmcytochalasin D experiment was 116%. d, Cumulative distribution of the ratio of LTP path EPSP over non-LTP path EPSP from individual experiments, measured at 45–50 min after LTP induction. Open circles are for DMSO control experiments (n = 9), filled circles are for latrunculin B experiments (n = 5), andtriangles and rectangles are for 5 (n = 7) and 10 (n = 4) μm cytochalasin D, respectively. The shift of the distribution produced by APIs suggests that LTP induction was reduced significantly (K–S test; Q ≪ 0.01). B, Latrunculin did not strongly affect the temporal pattern of vesicle release during 25 Hz theta-burst induction protocol. The slope of each fEPSP during theta burst was normalized to that of first fEPSP of the first burst. a, 1st (thin line) and 10th (thick line) burst average traces from control experiment. Calibration: 5 mV, 200 msec. b, The measurement of slope of fEPSPs during theta burst without latrunculin B (n = 4).c, Example traces of1st (thin line) and 10th(thick line) burst under 2 μm latrunculin B application. These traces are from the same slice as those shown in a. Calibration: 5 mV, 200 msec.d, The measurement of slope of fEPSPs during theta burst with 2 μm latrunculin B (n = 4).
Fig. 5.
Fig. 5.
Representative experiments in which effects on LTP induction of postsynaptic DMSO or latrunculin B were measured.Gray bar indicates the period of internal perfusion of latrunculin B or DMSO through perfusion pipette. Hatched box indicates the period of pairing. A, An experiment in which 0.1% DMSO internal solution was applied for 18 min, and LTP was then induced by pairing. Inset, Averagetraces for 10 min before (thin line,1) and after (thick line,2) pairing. Calibration: 400 pA, 60 msec. Top panel shows the measurement of series resistance for the recording. Middle panel shows the magnitude of EPSC as a function of time. Bottom panel shows the ratio of amplitude of LTP over non-LTP path synaptic responses. Each point is the average of 20 traces. B, An experiment in which 200 μm latrunculin B (in 0.1% DMSO) was applied postsynaptically. Eighteen minutes later, LTP was induced by pairing.Inset, Average trace 10 min before (thin line, 1) and after (thick line, 2) pairing. Calibration: 250 pA, 60 msec.
Fig. 6.
Fig. 6.
Postsynaptically applied latrunculin B reduces pairing-induced LTP without affecting NMDAR-mediated EPSC. Gray bar indicates the period of internal perfusion of latrunculin B or DMSO through perfusion pipette. Arrow indicates the pairing. A, In control, ≤0.4% DMSO was applied starting 2 min after the initiation of whole-cell recording (n = 26). Eighteen minutes later, LTP was induced by pairing in one pathway (filled rectangles). The initial average potentiation measured at 2 min after induction was 283% of the baseline. The average EPSCs of LTP path and non-LTP path (open rectangles) at 30 min after pairing were 267 and 85%, respectively. B, Postsynaptic latrunculin B reduced pairing-induced LTP. Latrunculin B (100 μm;n = 16; 80 μm; n= 2) in DMSO (total, n = 18) was internally applied 2 min after whole-cell recording, and then pairing was applied 18 min later. The initial average potentiation measured at 2 min after induction was 207% of the baseline (filled circles). The average EPSCs (n = 18) in the LTP path and in the non-LTP path (open circles) at 30 min after pairing were 156 and 69% of the baseline, respectively (those values with 100 μmlatrunculin B were 150 and 68%; those with 80 μm were 194 and 101%). C, Cumulative distribution of the ratio of EPSC in LTP path over that in non-LTP path from individual experiments, measured 30 min (asterisk in A and B) after LTP induction. Open circles are for DMSO control experiments (n = 26), and filled circles are for latrunculin B experiments (n = 18). The shift of distribution by postsynaptic latrunculin B indicates that LTP induction measured at this time is reduced significantly (K–S test; Q ≪ 0.01).D, NMDAR-mediated EPSC was not significantly changed by postsynaptic latrunculin B. The bath solution contained 10 μm CNQX and 1.3 mm Mg2+. Latrunculin B (100 μm; n = 10; 80 μm; n = 5) was internally perfused starting 6 min after whole-cell recording (total, n= 17). The average EPSC (n = 17) at 40 min after latrunculin B application was 96% (that with 100 μm was 97%; that with 80 μm was 94%). As a control, ≤0.2% DMSO internal solution was perfused (n = 23).Inset, Representative average traces of NMDAR EPSC 8 min before (thin line, 1) and after (thick line, 2) 80 μmlatrunculin B application. Calibration: 60 pA, 90 msec.
Fig. 7.
Fig. 7.
Postsynaptically applied phalloidin reduces the AMPAR-mediated EPSC but does not affect the NMDAR-mediated EPSC.Gray bar indicates the period of internal perfusion of phalloidin or DMSO. A, Effect of 100 μmphalloidin (in 0.1% DMSO; n = 20) on basal AMPAR-mediated synaptic transmission compared with that with 0.1% DMSO alone (n = 14). Results are the average of the number of experiments (n). Drug was applied 10 min after initiation of whole-cell recording. Holding voltage, −65 mV.Insets a and b show the example averagetraces for 10 min before (1) and 50 min after (2) phalloidin or DMSO alone application, respectively. B, Effect of 100 μm phalloidin (in 0.1% DMSO; n = 24) on the NMDAR-mediated EPSC compared with that with 0.1% DMSO alone (n = 18). Membrane potential was held at −50 to −65 mV (adjusted in each experiment to give ∼70 pA response). Drug was applied 10 min after initiation of whole-cell recording. Application (50 min) of phalloidin did not significantly reduce the NMDAR-mediated EPSC amplitude compared with that with DMSO alone (t test; p ≫ 0.05). Insets a and b show the example averagetraces for 10 min before (1) and after (2) phalloidin or DMSO alone application, respectively. Calibration: 70 pA, 150 msec. C, Effect of phalloidin on AMPAR- and NMDAR-mediated EPSCs. The effect of phalloidin was measured as the ratio of the average EPSC with phalloidin application over that with DMSO alone. Thin trace shows the ratio for the NMDAR-mediated EPSC measurements shown inB. Thick broken trace shows the ratio for the AMPAR-mediated EPSC measurements shown in A.
Fig. 8.
Fig. 8.
Postsynaptically applied phalloidin reduces the LTP induced by pairing. Gray bar indicates the period of internal perfusion of phalloidin or DMSO, and thick arrow indicates pairing. Error bars indicate SEM.A, In controls, 0.1% DMSO was perfused 2 min after the initiation of whole-cell recording (n = 8), and LTP was induced 18 min later. The initial average potentiation measured 4 min after induction was 243% to the baseline (filled rectangles). The average EPSCs in the LTP path and in the non-LTP path (open rectangles) measured at 50 min after induction were 278 and 104% to the baseline, respectively.B, Phalloidin (100 μm) was internally applied 2 min after the initiation of whole-cell recording (n = 7), and LTP was induced by pairing 18 min later. The initial average potentiation measured at 4 min after induction was 178% of the baseline (filled circles). The average EPSCs in the LTP path and in the non-LTP path (open circles) measured at 50 min after induction were 99 and 46% of the baseline, respectively. Bottom traces show the input resistance and the series resistance as a function of time, respectively. C, Cumulative distribution of the ratio of EPSC in the LTP path over that in the non-LTP path at 30 min (asterisks in Band C) after LTP induction. The distribution in phalloidin (filled circles; n= 5) is significantly shifted from that in control DMSO experiment (open circles; n = 8), indicating a significant reduction of LTP at 30 min after induction caused by phalloidin (K–S test; Q ≪ 0.01).
Fig. 9.
Fig. 9.
Postsynaptically applied phalloidin reduces the maintenance of pairing-induced LTP. Gray bar indicates the period of internal perfusion of phalloidin or DMSO, andthick arrow indicates pairing. Error bars indicate SEM.A, In control (n = 8), 0.1% DMSO was applied 2 min after LTP induction by pairing (filled rectangles). The average EPSCs in the LTP and in the non-LTP pathway (open rectangles) measured 2 min after pairing were 330 and 81% of the baseline. The average EPSCs in the LTP path and in the non-LTP path measured at 50 min after induction were 407 and 114% of the baseline, which gave 357% of relative potentiation.B, Phalloidin (100 μm) was perfused 2 min after pairing (n = 9). The average EPSCs in the LTP path (filled circles) and in the non-LTP path (open circles) measured at 2 min after induction were 311 and 74% of the baseline. The average EPSCs in the LTP path and in the non-LTP path measured at 50 min after induction were 134 and 49% of the baseline, which gave 273% of relative potentiation. Therefore, phalloidin application reduced the potentiation of LTP by 33% at 50 min after induction. Bottom panelshows the input resistance as a function of time. C, Ratio of average EPSC in the LTP path over that in the non-LTP path as a function of time. The ratio was normalized to the ratio at 2 min after induction. The larger decay in the ratio was produced by phalloidin (filled circles; n= 9; from B) compared with that with DMSO control (open circles; n = 8; fromA), which indicates a more selective effect of phalloidin on LTP maintenance. Cumulative distribution of the ratio of EPSC in the LTP path to that in the non-LTP path measured at 30 min after LTP induction (asterisks inA and B). The ratio from phalloidin experiment (filled circles; n= 8) was significantly shifted from that from control DMSO experiment (open circles; n = 8), indicating a significant reduction in LTP at 30 min after induction by postsynaptic phalloidin (K–S test; Q ≪ 0.01).

Similar articles

Cited by

References

    1. Allison DW, Gelfand VI, Spector I, Craig AM. Role of actin in anchoring postsynaptic receptors in cultured hippocampal neurons: differential attachment of NMDA versus AMPA receptors. J Neurosci. 1998;18:2423–2436. - PMC - PubMed
    1. Bernstein BW, Bamburg JR. Cycling of actin assembly in synaptosomes and neurotransmitter release. Neuron. 1989;3:257–265. - PubMed
    1. Bortolotto ZA, Collingridge GL. Involvement of calcium/calmodulin-dependent protein kinases in the setting of a molecular switch involved in hippocampal LTP. Neuropharmacology. 1998;37:535–544. - PubMed
    1. Calakos N, Scheller RH. Synaptic vesicle biogenesis, docking, and fusion: a molecular description. Physiol Rev. 1996;76:1–29. - PubMed
    1. Charlton MP, Smith SJ, Zucker RS. Role of presynaptic calcium ions and channels in synaptic facilitation and depression at the squid giant synapse. J Physiol (Lond) 1982;323:173–193. - PMC - PubMed

Publication types

LinkOut - more resources