. 1999 Jun 1;19(11):4325-36.
doi: 10.1523/JNEUROSCI.19-11-04325.1999.

Calcium-induced calcium release contributes to action potential-evoked calcium transients in hippocampal CA1 pyramidal neurons

Affiliations

Calcium-induced calcium release contributes to action potential-evoked calcium transients in hippocampal CA1 pyramidal neurons

V M Sandler et al. J Neurosci. .

Abstract

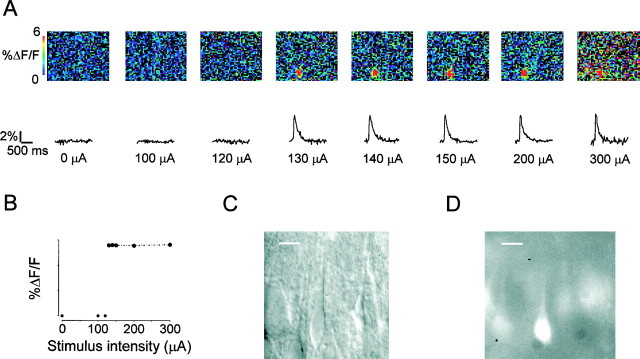
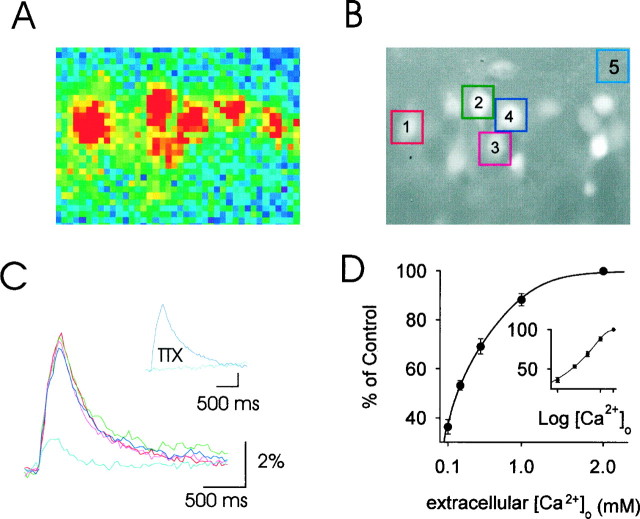
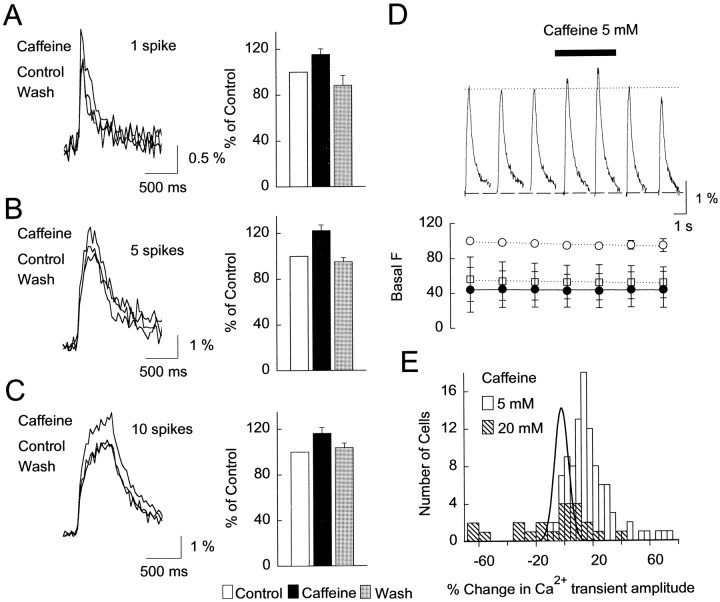
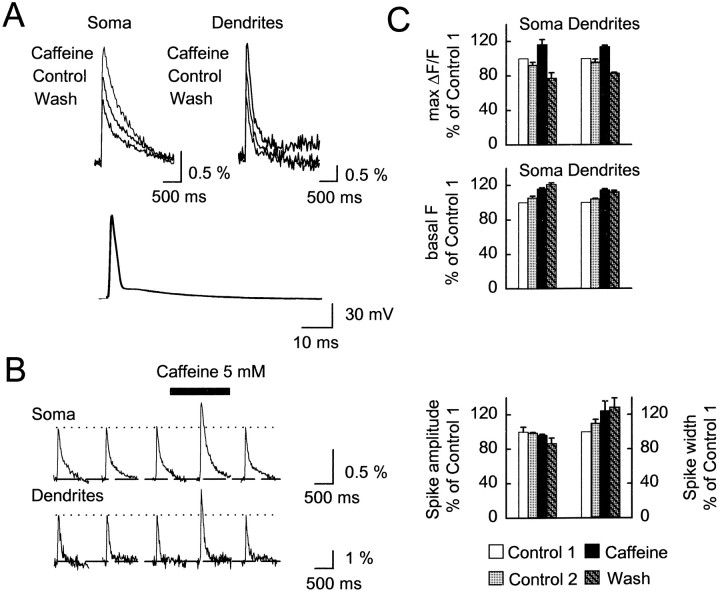
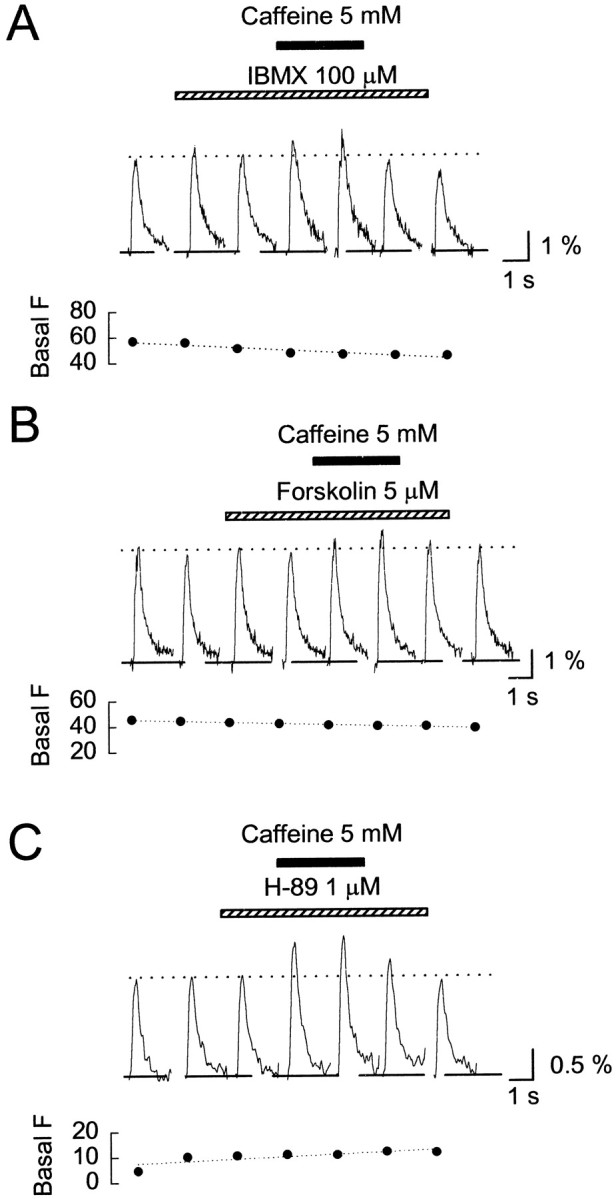
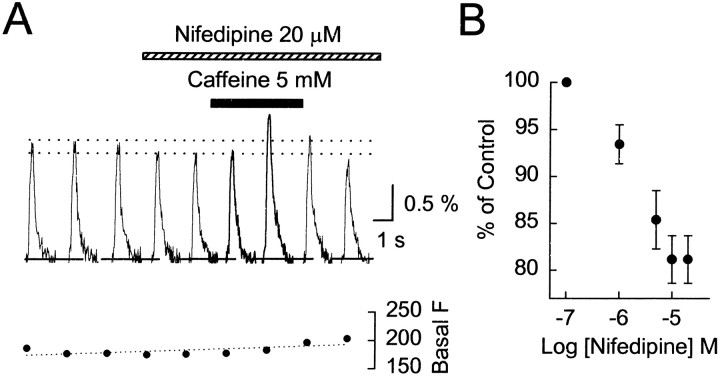
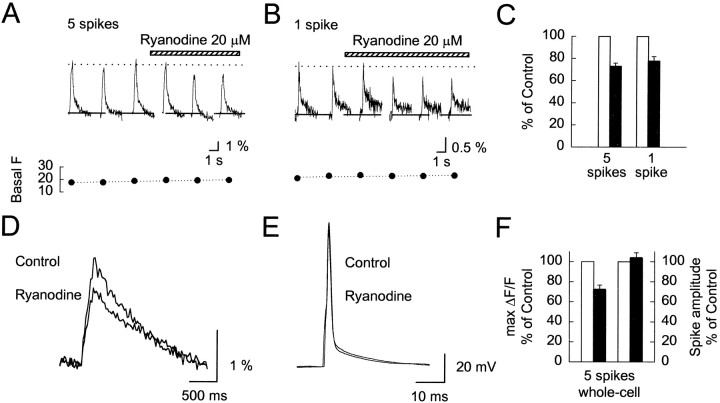
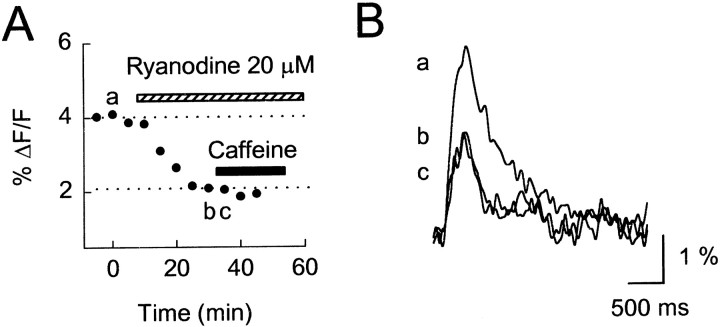
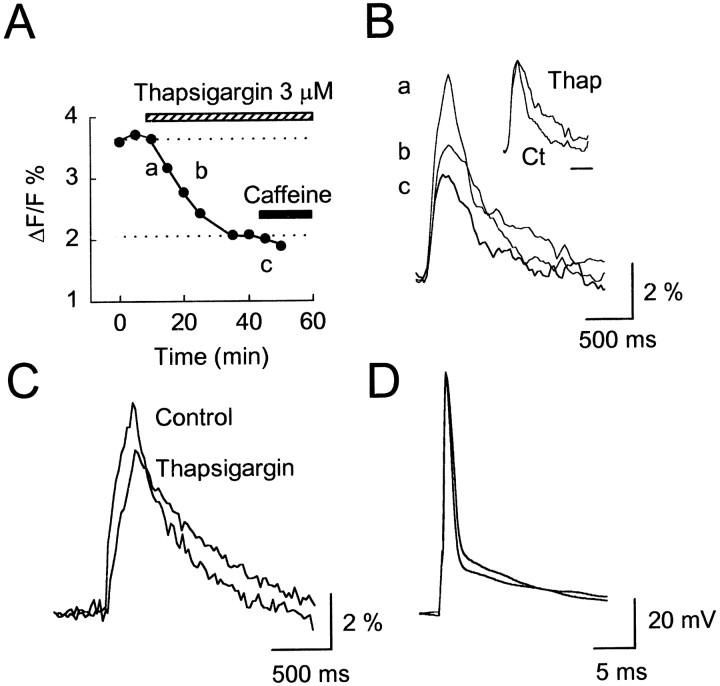
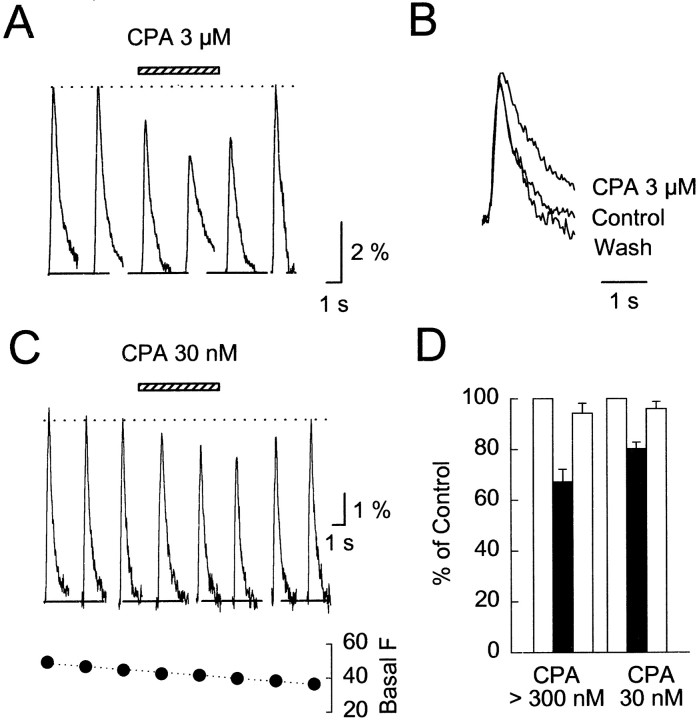
Calcium-induced calcium release (CICR) is a mechanism by which local elevations of intracellular calcium (Ca2+) are amplified by Ca2+ release from ryanodine-sensitive Ca2+ stores. CICR is known to be coupled to Ca2+ entry in skeletal muscle, cardiac muscle, and peripheral neurons, but no evidence suggests that such coupling occurs in central neurons during the firing of action potentials. Using fast Ca2+ imaging in CA1 neurons from hippocampal slices, we found evidence for CICR during action potential-evoked Ca2+ transients. A low concentration of caffeine enhanced Ca2+ transient amplitude, whereas a higher concentration reduced it. Simultaneous Ca2+ imaging and whole-cell recordings showed that membrane potential, action potential amplitude, and waveform were unchanged during caffeine application. The enhancement of Ca2+ transients by caffeine was not affected by the L-type channel blocker nifedipine, the phosphodiesterase inhibitor IBMX, the adenylyl cyclase activator forskolin, or the PKA antagonist H-89. However, thapsigargin or ryanodine, which both empty intracellular Ca2+ stores, occluded this effect. In addition, thapsigargin, ryanodine, and cyclopiazonic acid reduced action potential-evoked Ca2+ transients in the absence of caffeine. These results suggest that Ca2+ release from ryanodine-sensitive stores contributes to Ca2+ signals triggered by action potentials in CA1 neurons.


Figures

Fig. 1.
Fig. 1.
Recording of all-or-none Ca2+transients in a CA1 neuron triggered by a single antidromic stimulation. A, Changes of [Ca2+]i during a single stimulation of increasing intensity in the alveus. Top panels, ΔF/F pseudocolor images during the stimulation show a clear area of high ΔF/F corresponding to a single CA1 neuron. Bottom traces correspond to spatial averages of ΔF/F over a 5 × 5 pixels area positioned over the stimulated neuron. B, Plot of maximal spatial averages of ΔF/Fagainst the stimulus intensity. C, Bright-field image of the stimulated neuron. D, Fluorescence image of the same neuron recorded at 380 nm. Scale bars: C,D, 20 μm.
Fig. 2.
Fig. 2.
Properties of Ca2+ transients recorded simultaneously in several pyramidal neurons from the CA1 layer of an hippocampal slice. A, ΔF/F pseudocolor images during five antidromic stimulating pulses. Note that at least six neurons are stimulated. B, Corresponding fluorescence image (380 nm) showing that high ΔF/F regions inA correspond to the fura-2-loaded neurons in the CA1 pyramidal cell layer. The alveus is upward in the micrograph. C, Ca2+ transients corresponding to the neurons shown in B. Thelight blue trace, sampled from region 5, was taken to illustrate a background signal and showed no visible loaded neuron. Inset, Example of a Ca2+ transient abolished with 1 μmTTX. D, Dependence of Ca2+ transients evoked by five action potentials on external [Ca2+]o (n = 5–20 cells for each concentration). Inset, Log plot of the same data.
Fig. 3.
Fig. 3.
Effect of caffeine on Ca2+transients evoked by 1–10 antidromic stimulations. A, Ca2+ transients evoked by a single action potential were potentiated by the application of caffeine (5 min, 5 mm). Average data are illustrated on theright. B, Same as in A, except that five action potentials were evoked. C, Same as in A, except that 10 action potentials were evoked. Average data are from 10–16 cells. D, Time course of the action of caffeine (5 mm). Traces were recorded at 5 min intervals, except for the fourth trace, which was recorded after 1 min of caffeine application. Basal Fvalues, with no stimulation, are plotted correspondingly to each trace. (○), Basal F at the location of the cell; ■, background F (see Materials and Methods); (●), difference between the two fluorescence values. E, Histograms of the changes of Ca2+ transient amplitudes by 5 and 20 mm caffeine. The linein the histogram of caffeine action represents a fit of the control histogram (see Materials and Methods).
Fig. 4.
Fig. 4.
The caffeine-induced increase in Ca2+ transients does not depend on a change in action potentials, which are recorded with whole-cell patch clamp.A, Caffeine (5 mm) potentiates Ca2+ transients both in the soma and in the proximal dendrites of a CA1 neuron recorded in current-clamp mode (top panels). Action potentials before, during, and after caffeine application are superimposed in the bottom panel. No significant change in action potential waveform is observed during the caffeine application. B, Time course of caffeine effect in a neuron recorded in whole-cell configuration. Three controls are shown separated by 5 min intervals. The fourth traceswere recorded after 1 min of caffeine application. C, Average data are from five neurons. Maximal ΔF/F values were recorded 10 and 5 min before caffeine application (Control 1 andControl 2, respectively), during the caffeine application, and after wash of caffeine. Maximal ΔF/F values were increased in the presence of caffeine (top plot). Basal fluorescence (F) recorded at 380 nm slightly and linearly increased in the soma but did not change when caffeine was applied or removed. Spike amplitude and spike width were unaffected by the application of caffeine (bottom plot).
Fig. 5.
Fig. 5.
The caffeine-induced increase in Ca2+ transients is not mediated by a rise in cyclic nucleotides. A, IBMX (100 μm) has little effect on Ca2+ transients (second andthird traces) and does not occlude caffeine action (fourth and fifth traces).B, Same as in A except that forskolin (5 μm) was applied. C, Same as inA except that H-89 was used. Dashed linesindicate the time of application of IBMX, forskolin, or H-89.Solid lines indicate the 5 min caffeine application. Ca2+ transients in the presence of caffeine were recorded after 1 and 3 min of caffeine application. Except during the caffeine application, the traces are separated by 5 min intervals. Background F is plotted correspondingly to each Ca2+ transient in the bottom panels. The traces for A–C were recorded from three representative cells. See Table 1 for average results.
Fig. 6.
Fig. 6.
L-type Ca2+ channels are not required for the effect of caffeine on Ca2+transients. A, Nifedipine (20 μm) reduces Ca2+ transient amplitude (fourth and fifth traces) but does not occlude caffeine action (sixth and seventh traces). Three controls are shown separated by 5 min intervals. The sixth and seventh traces were recorded after 1 and 3 min of caffeine application, respectively. No change in basal fluorescence (F) was observed when the drugs were applied. B, Dose–response curve of nifedipine on the reduction of Ca2+ transient amplitude. Each point is from five to six cells.
Fig. 7.
Fig. 7.
Ryanodine reduces Ca2+transient amplitude. A, Ryanodine (20 μm) reduced Ca2+ transient amplitude to a stable level. Traces were recorded every 5 min. Ca2+ transients were evoked by five action potentials. No change in basal fluorescence (F) was associated with the application of ryanodine. B, Same as in A except that Ca2+ transients were evoked by a single action potential. C, Average data of the effect of ryanodine on Ca2+ transients evoked by five spikes (left bars) and one spike (right bars). Open bars, Controls; filled bars, ryanodine (20 μm). Data are from 20–24 cells. D, Ryanodine (20 μm) reduced Ca2+transient amplitude in a whole-cell recorded neuron. E, No change in action potential occurred when ryanodine was applied. Spikes and Ca2+ transients were recorded simultaneously. F, Average data of the effect of ryanodine (20 μm) in whole-cell recorded neurons on Ca2+ transient amplitude evoked by five spikes (left bars) and on the first spike amplitude (right bars). Open bars, Controls;filled bars, ryanodine (20 μm).
Fig. 8.
Fig. 8.
Ryanodine occludes the effect of caffeine.A, Ryanodine (20 μm) reduced the amplitude of Ca2+ transients evoked with five action potentials and occluded caffeine action on Ca2+transients. B, Selected traces (a–c) are shown corresponding to the points labeleda–c in the plot in A. The cell was stimulated by five action potentials every 20 sec between measurements of the Ca2+ transients. See Table 1 for average results.
Fig. 9.
Fig. 9.
Thapsigargin reduces Ca2+transient amplitude and occludes the effect of caffeine.A, Thapsigargin (3 μm) reduced Ca2+ transient amplitude and occluded caffeine action on Ca2+ transients. B, Selected traces (a–c) are shown corresponding to thepoints labeled a–c in the plot inA. Inset, Traces a andb have been scaled to visualize the change in kinetics induced by thapsigargin. Time scale, 500 msec. C, Thapsigargin (3 μm) reduced Ca2+transient amplitude in a whole-cell recorded neuron. D, No change in action potential occurred when thapsigargin was applied. Ca2+ transients were evoked with five action potentials throughout.
Fig. 10.
Fig. 10.
Cyclopiazonic acid (CPA) reversibly reduces Ca2+ transient amplitude. A, CPA (3 μm) applied for 20 min reduced Ca2+transient amplitudes (third and fourth traces). A full wash of CPA allows for the complete recovery of Ca2+ transient amplitude. The traces were recorded every 10 min. B, Effect of CPA (3 μm) on the decay of Ca2+ transients. Transients have been scaled for a comparison of their kinetics. C, CPA (30 nm) applied for 10 min reduced Ca2+transient amplitudes (fourth and fifth traces). A full wash of CPA allowed for the complete recovery of Ca2+ transient amplitude (eighth trace). The traces were recorded every 5 min. No change in basal fluorescence (F) was associated with the application of CPA. D, Average results for the effect of >300 nm CPA (left bars) and 30 nm CPA (right bars). For each group of bars the first bar is the control, the second bar is CPA, and the third bar is wash.

Similar articles

Cited by

References

    1. Bear MF, Malenka RC. Synaptic plasticity: LTP and LTD. Curr Opin Neurobiol. 1994;4:389–399. - PubMed
    1. Beavo JA, Reifsnyder DH. Primary sequence of cyclic nucleotide phosphodiesterase isozymes and the design of selective inhibitors. Trends Pharmacol Sci. 1990;11:150–155. - PubMed
    1. Belousov AB, Godfraind JM, Krnjevic K. Internal Ca2+ stores involved in anoxic responses of rat hippocampal neurons. J Physiol (Lond) 1995;486:547–556. - PMC - PubMed
    1. Berridge MJ. Neuronal calcium signaling. Neuron. 1998;21:13–26. - PubMed
    1. Bezprozvanny I, Watras J, Ehrlich BE. Bell-shaped calcium–response curves of Ins1,4,5P3- and calcium-gated channels from endoplasmic reticulum of cerebellum. Nature. 1991;351:751–754. - PubMed

Publication types

LinkOut - more resources