. 1999 Jun 1;19(11):4449-61.
doi: 10.1523/JNEUROSCI.19-11-04449.1999.

Glutamate acting at NMDA receptors stimulates embryonic cortical neuronal migration

Affiliations

Glutamate acting at NMDA receptors stimulates embryonic cortical neuronal migration

T N Behar et al. J Neurosci. .

Abstract

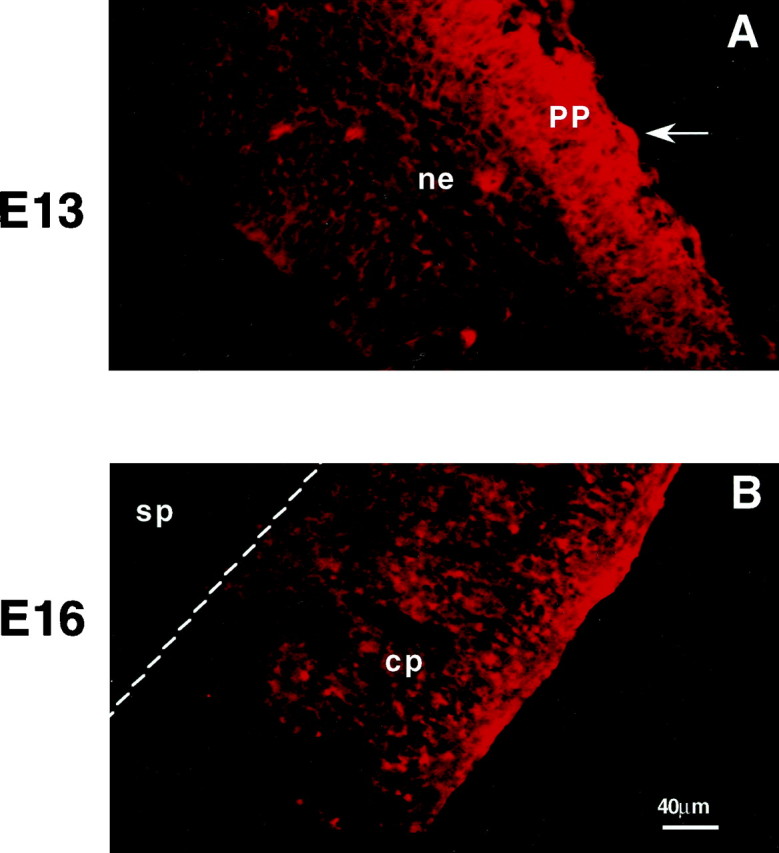
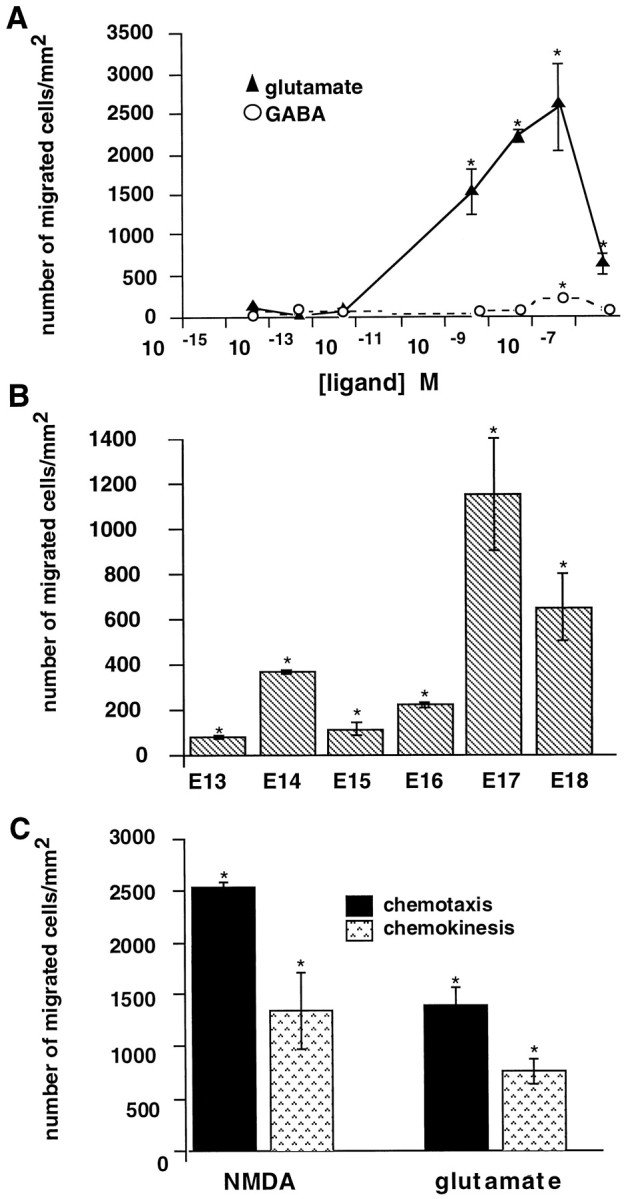
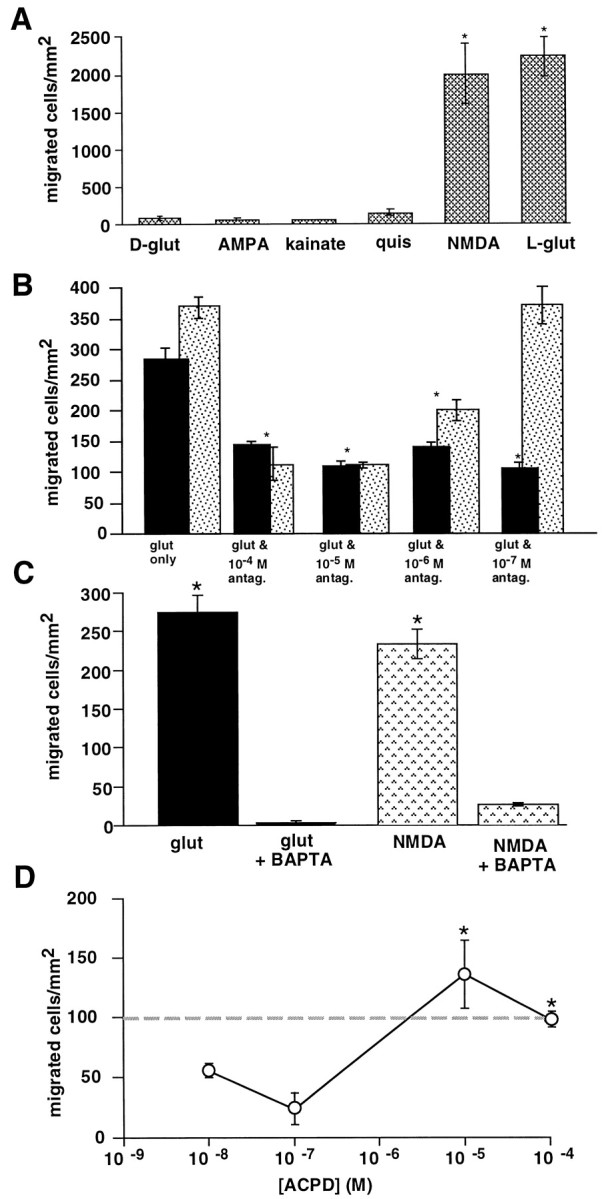
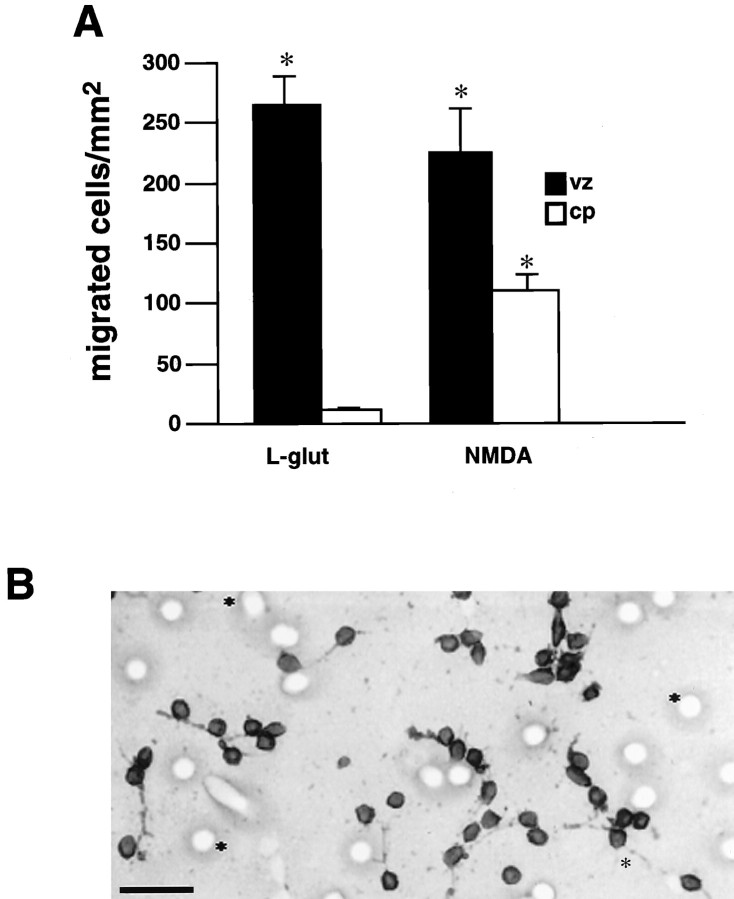
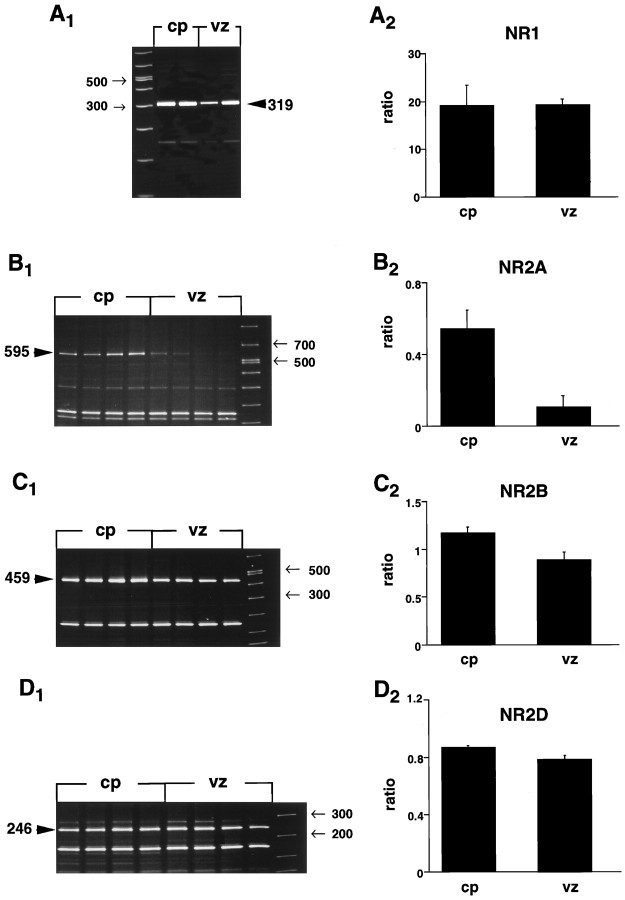
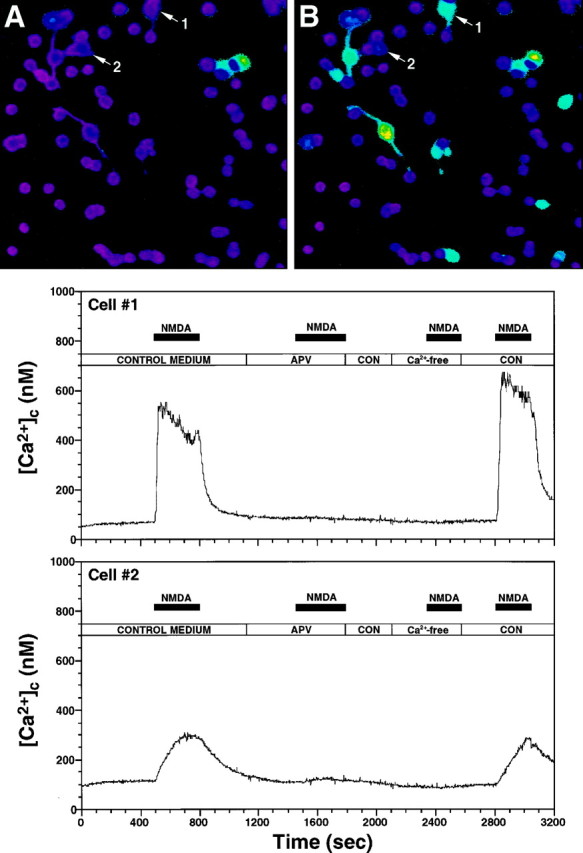
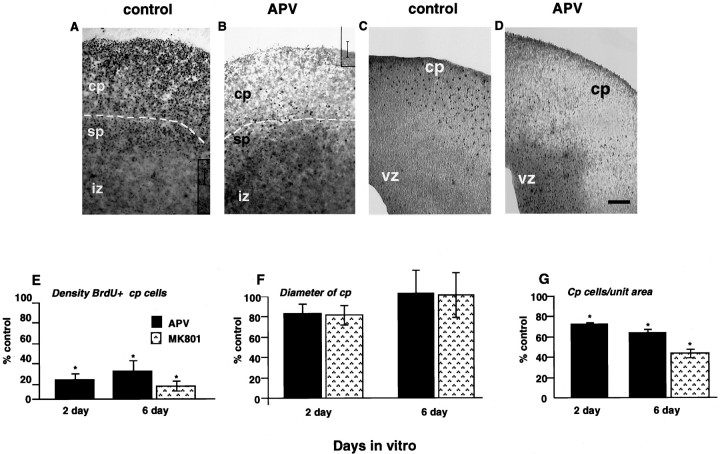
During cortical development, embryonic neurons migrate from germinal zones near the ventricle into the cortical plate, where they organize into layers. Mechanisms that direct neuronal migration may include molecules that act as chemoattractants. In rats, GABA, which localizes near the target destination for migrating cortical neurons, stimulates embryonic neuronal migration in vitro. In mice, glutamate is highly localized near the target destinations for migrating cortical neurons. Glutamate-induced migration of murine embryonic cortical cells was evaluated in cell dissociates and cortical slice cultures. In dissociates, the chemotropic effects of glutamate were 10-fold greater than the effects of GABA, demonstrating that for murine cortical cells, glutamate is a more potent chemoattractant than GABA. Thus, cortical chemoattractants appear to differ between species. Micromolar glutamate stimulated neuronal chemotaxis that was mimicked by microM NMDA but not by other ionotropic glutamate receptor agonists (AMPA, kainate, quisqualate). Responding cells were primarily derived from immature cortical regions [ventricular zone (vz)/subventricular zone (svz)]. Bromodeoxyuridine (BrdU) pulse labeling of cortical slices cultured in NMDA antagonists (microM MK801 or APV) revealed that antagonist exposure blocked the migration of BrdU-positive cells from the vz/svz into the cortical plate. PCR confirmed the presence of NMDA receptor expression in vz/svz cells, whereas electrophysiology and Ca2+ imaging demonstrated that vz/svz cells exhibited physiological responses to NMDA. These studies indicate that, in mice, glutamate may serve as a chemoattractant for neurons in the developing cortex, signaling cells to migrate into the cortical plate via NMDA receptor activation.


Figures

Fig. 1.
Fig. 1.
Glutamate immunoreactivity in the embryonic murine cortex. Photomicrographs of coronal sections of the embryonic cortex immunostained with anti-glutamate antisera.A, At E13, glutamate-immunoreactive cells (arrow) and processes are evident in the primordial plexiform layer (PP). B, By E16, fibers in the outer half of the cortical plate are highly immunoreactive for glutamate. ne, Neuroepithelium; cp, cortical plate; sp, subplate. Scale bar, 40 μm.
Fig. 2.
Fig. 2.
Glutamate is a more potent chemoattractant than GABA for dissociated murine embryonic cortical cells. A, Glutamate and GABA stimulate migration in a dose-dependent manner. At E17, distinctive ranges of glutamate (▴) or GABA (○) stimulate cells to migrate. Maximum numbers of migrating cells occur at 500 nm glutamate; however, significant migration (>50 cells/mm2) is observed at glutamate concentrations ranging between 5 nm and 5 μm. Nanomolar GABA also stimulates motility but at lower levels. At all effective concentrations, glutamate stimulates more migration than GABA.B, Response by age. Glutamate (1 μm) stimulates migration from E13 onward. Peak migratory responses to glutamate are observed at E17. C, Characterization of migration. Glutamate (1 μm) or NMDA stimulate both directed migration (chemotaxis) and random motility (chemokinesis). Approximately twice as many cells migrate in the presence of a chemical gradient (•) than in the absence of one (▧). Error bars indicate SEM. *p ≤ 0.01; ANOVA followed by Fisher’s PLSD test. Separate trials: A, Glutamate,n = 6; GABA, n = 4;B, E13, n = 3; E14,n = 3; E15, n = 3; E16,n = 3; E17, n = 6; E18,n = 3; C, n = 4.
Fig. 3.
Fig. 3.
NMDA receptors mediate glutamate-induced cortical cell migration. A, Only NMDA mimics the effects of glutamate. E17 cells were migrated to 1 μml-glutamate, d-glutamate, kainate, quisqualate, NMDA, or AMPA. Only NMDA stimulates a similar level of motility asl-glutamate. B, MK801 or APV, antagonists at NMDA receptors, reduce the number of cells migrating to glutamate. Glutamate (1 μm) was mixed with serial dilutions of MK801 or APV (100 nm to 100 μm). At all concentrations of MK801, migration to glutamate was inhibited ∼50%. APV blocked glutamate-induced migration in a dose-dependent manner.C, Inhibition of migration by BAPTA-AM. Migration of E17 cells to 1 μm glutamate (•) or NMDA (▧) is entirely blocked in the presence of 10 μm BAPTA-AM.D, The metabotropic receptor agonist ACPD stimulates migration in a dose-dependent manner. Migratory responses to micromolar concentrations of ACPD (1–100 μm) are similar to migration induced by 1 μm glutamate (dashed line). Lower levels of ACPD fail to stimulate significant migration (>50 cells/mm2). *p≤ 0.01; ANOVA followed by Fisher’s PLSD test. Separate trials:A, n = 5; B,n = 3; C, n = 3.
Fig. 4.
Fig. 4.
Response by region. A, In vitro migratory responses of vz and cp cells. Vz cells (filled bars) exhibit greater migration to 1 μm glutamate or NMDA than cp cells (open bars) Significant numbers of cp cells do not respond to glutamate. Error bars indicate SEM. *p ≤ 0.01; ANOVA followed by Fisher’s PLSD test. B, Vz neurons migrate to glutamate. Vz cells were immunolabeled for neurofilament protein after migrating to glutamate in the chemotaxis assay. All vz cells that migrate to glutamate in vitro express neurofilament protein, indicating that they are neurons.Asterisks denote 8 μm pore in the membrane. Scale bar, 20 μm. Separate trials: A, B,n = 7.
Fig. 5.
Fig. 5.
Vz cells express mRNA encoding NMDA receptors subunits. Semiquantitative PCR was used to probe E17 vz and cp dissociates for mRNA encoding NR1 (A1,A2), NR2A (B1,B2), NR2B (C1,C2), and NR2D (D1,D2) subunits. Densitometry (A2, B2,C2, D2) revealed average relative abundance of transcripts in tissue homogenates from each region. For each region, n = 3.
Fig. 6.
Fig. 6.
NMDA induces increases in [Ca2+]c in vz cells. After recording their resting [Ca2+]c in control (CON) medium (A), the cells were sequentially exposed to 10 μm NMDA (B), 100 μm APV plus 10 μm NMDA, followed by 10 μm NMDA in [Ca2+]o-free saline (see logabove the traces for the duration of each exposure). The data show rapid (Cell #1) and slow (Cell #2) [Ca2+]cresponses evoked by NMDA, typical of those recorded in the vz population. Both responses were reversibly blocked by APV and eliminated in [Ca2+]o-free saline.
Fig. 7.
Fig. 7.
NMDA-induced currents in vz cells.A, At 1 μm, NMDA induces a small (1.12 ± 0.01 pA; p < 0.001) inward current deflection that is significantly different from the holding current. At higher concentrations (B, C), NMDA induces larger currents with obvious superimposed open-channel noise. At the higher concentrations, the mean currents are 6.62 ± 0.04 pA at 10 μm (B) and 13.83 ± 0.08 pA at 50 μm (C). The current induced by 50 μm NMDA (C) is almost completely blocked by equimolar MK801 (0.16 ± 0.03).A and B were recorded from the same cell in the vz preparation; C was recorded from a different cell in the vz dissociate. Membrane potential was clamped at −80 mV.
Fig. 8.
Fig. 8.
Glutamate-induced migration of cells in cultured cortical slices. A, Control slice maintained in vitro for 48 hr after the BrdU pulse. Almost all BrdU-labeled cells are in the cp and sp. B, The contralateral slice treated for 48 hr with 100 μm APV has few BrdU-labeled cells in the cp or sp. Scale bar, 80 μm. C, Low magnification of an untreated control slice shows few labeled cells in the vz or iz. D, The contralateral treated slice has an abundance of labeled cells in the vz and iz. Scale bar, 80 μm.E, Densitometry of cultured slices. Densitometry of contralateral slices treated with with either 100 μmAPV (•) or MK801 (▧). E, Density of BrdU-labeled nuclei in the cortical plate. At 2 and 6 d, there is a significant reduction in the number of BrdU-labeled cells in the cp of antagonist-treated slices compared with controls. F, Cortical plate thickness. At 2 d, antagonist treatment results in a minor decrease in cp thickness. By 6 d, the thickness of the cortical plate is not significantly diminished. G, Density of total cells in the cortical plate. At both 2 and 6 d, antagonist treatment results in significantly fewer cells per unit area when compared with controls. *p ≤ 0.05; Student’st test. Separate trials: n = 5.

Similar articles

Cited by

References

    1. Angevine JB, Sidman RL. Autoradiographic study of cell migration during histogenesis of cerebral cortex in the mouse. Nature. 1961;192:766–768. - PubMed
    1. Armstrong RC, Harvath L, Dubois-Dalcq M. Type 1 astrocytes and oligodendrocyte-type 2 astrocyte glial progenitors migrate toward distinct molecules. J Neurosci Res. 1990;27:400–407. - PubMed
    1. Behar TN, Schaffner AE, Colton CA, Somogyi R, Olah Z, Lehel C, Barker JL. GABA-induced chemokinesis and NGF-induced chemotaxis of embryonic spinal cord neurons. J Neurosci. 1994;14:29–38. - PMC - PubMed
    1. Behar TN, Li YX, Tran HT, Ma W, Dunlap V, Scott C, Barker JL. GABA stimulates chemotaxis and chemokinesis of embryonic cortical neurons via calcium-dependent mechanisms. J Neurosci. 1996;16:1808–1818. - PMC - PubMed
    1. Behar TN, Schaffner AE, Scott CA, O’Connell C, Barker JL. Differential response of cortical plate and ventricular zone cells to GABA as a migration stimulus. J Neurosci. 1998;18:6378–6387. - PMC - PubMed

MeSH terms

Substances

LinkOut - more resources