. 1999 Jun 1;19(11):4498-507.
doi: 10.1523/JNEUROSCI.19-11-04498.1999.

Supporting cells contribute to control of hearing sensitivity

Affiliations

Supporting cells contribute to control of hearing sensitivity

A Flock et al. J Neurosci. .

Abstract

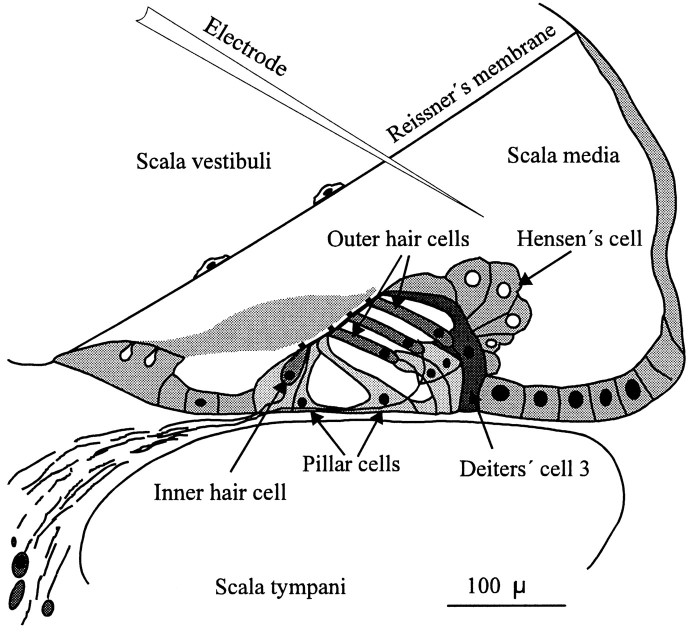
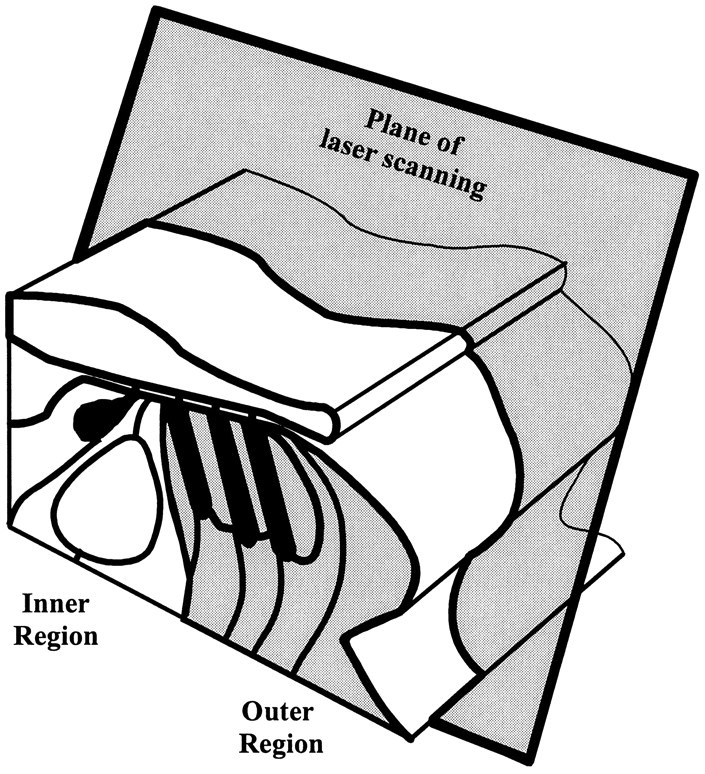
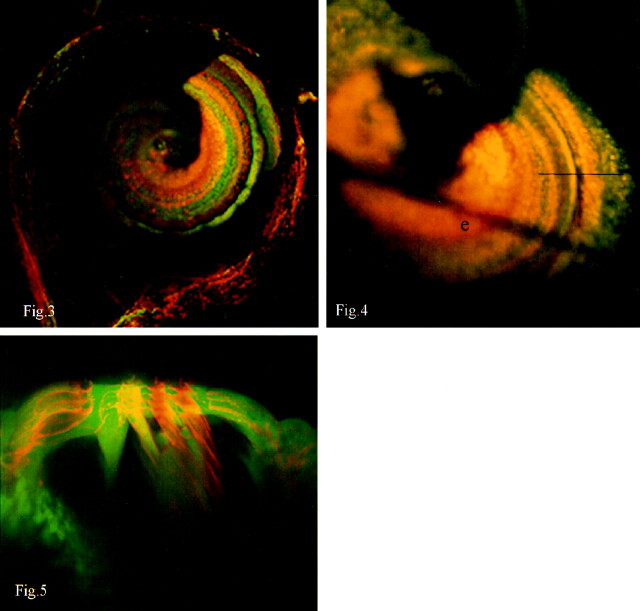
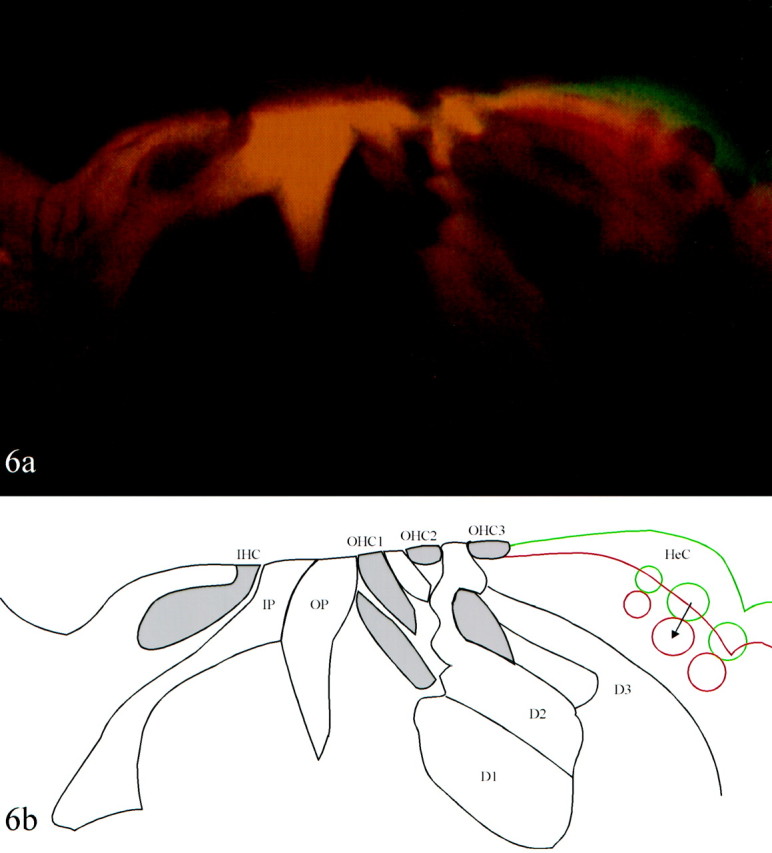
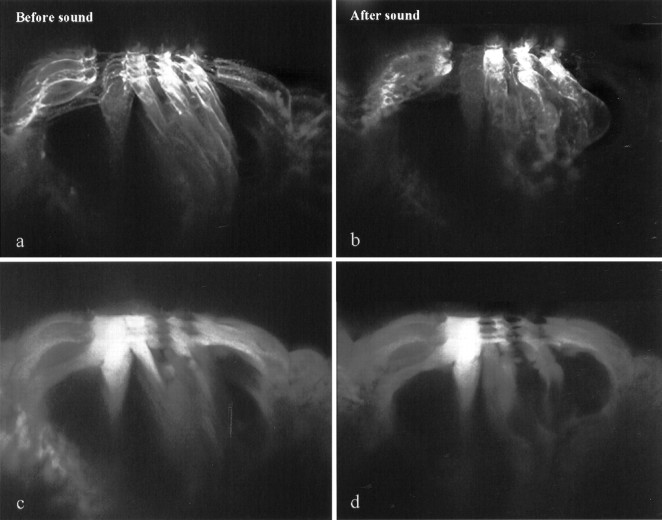
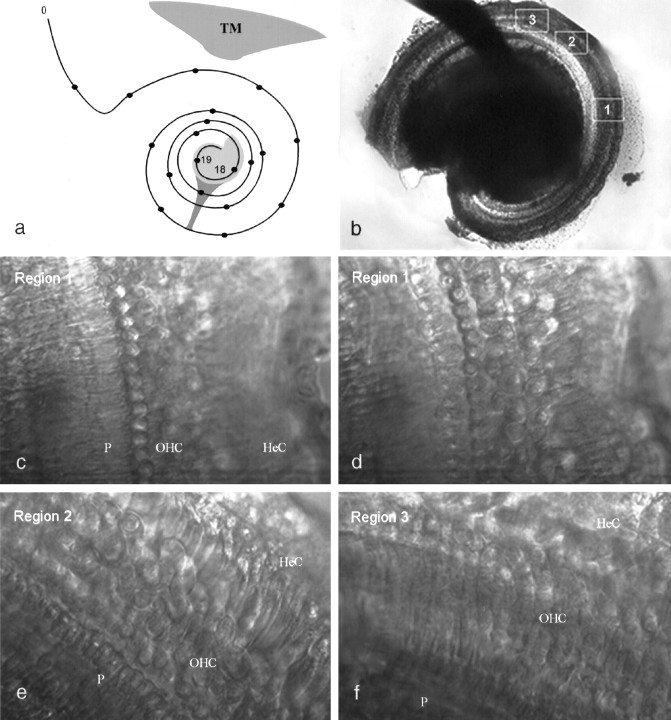
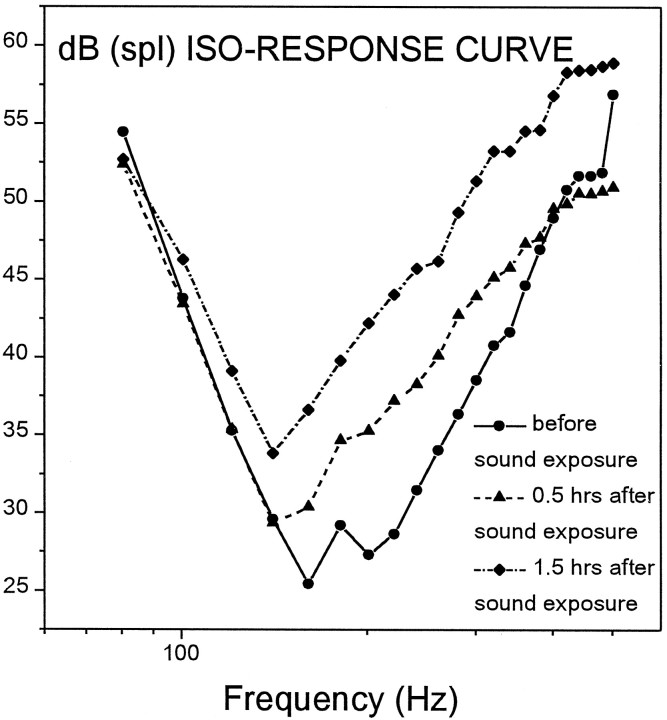
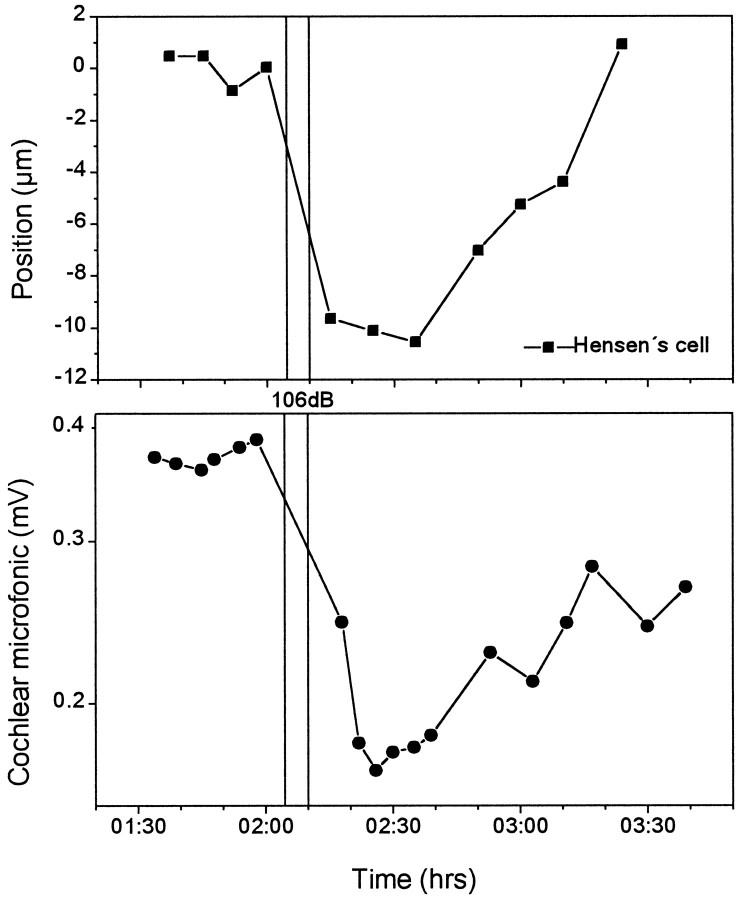
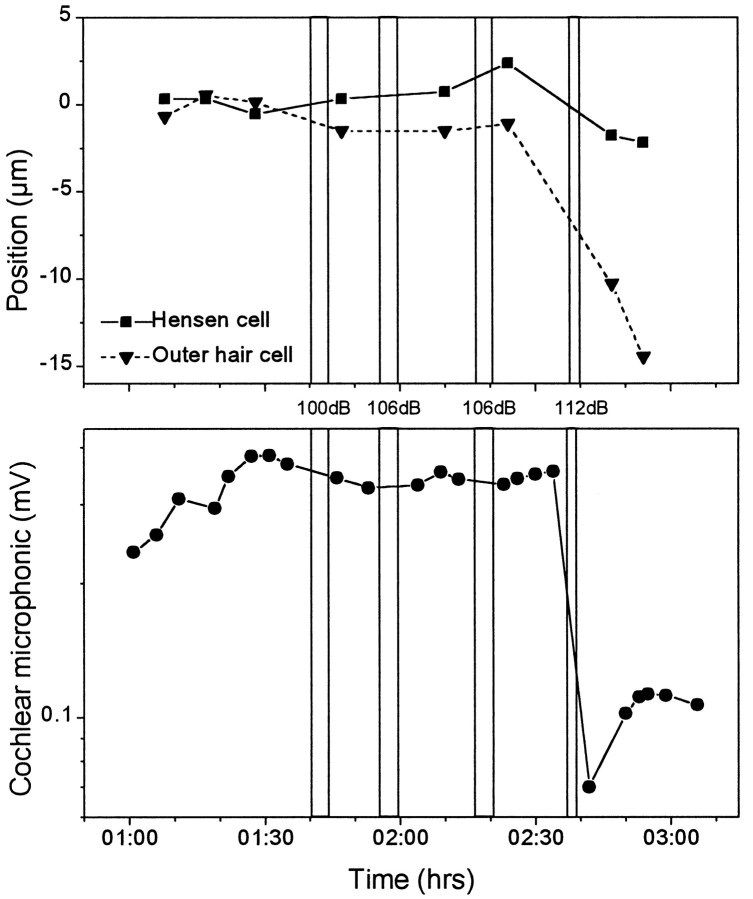
The mammalian hearing organ, the organ of Corti, was studied in an in vitro preparation of the guinea pig temporal bone. As in vivo, the hearing organ responded with an electrical potential, the cochlear microphonic potential, when stimulated with a test tone. After exposure to intense sound, the response to the test tone was reduced. The electrical response either recovered within 10-20 min or remained permanently reduced, thus corresponding to a temporary or sustained loss of sensitivity. Using laser scanning confocal microscopy, stimulus-induced changes of the cellular structure of the hearing organ were simultaneously studied. The cells in the organ were labeled with two fluorescent probes, a membrane dye and a cytoplasm dye, showing enzymatic activity in living cells. Confocal microscopy images were collected and compared before and after intense sound exposure. The results were as follows. (1) The organ of Corti could be divided into two different structural entities in terms of their susceptibility to damage: an inner, structurally stable region comprised of the inner hair cell with its supporting cells and the inner and outer pillar cells; and an outer region that exhibited dynamic structural changes and consisted of the outer hair cells and the third Deiters' cell with its attached Hensen's cells. (2) Exposure to intense sound caused the Deiters' cells and Hensen's cells to move in toward the center of the cochlear turn. (3) This event coincided with a reduced sensitivity to the test tone (i.e., reduced cochlear microphonic potential). (4) The displacement and sensitivity loss could be reversible. It is concluded that these observations have relevance for understanding the mechanisms behind hearing loss after noise exposure and that the supporting cells take an active part in protection against trauma during high-intensity sound exposure.


Figures

Fig. 1.
Fig. 1.
Schematic drawing of the cochlear partition showing its structural components and the position of the microelectrode.
Fig. 2.
Fig. 2.
Schematic drawing illustrating how the preparation was tilted with respect to the plane of confocal laser scanning to obtain LSCM images, showing nearly radial sections of the organ of Corti (compare Figs. 1, 5).
Fig. 3.
Fig. 3.
Low-power LSCM image of the apex of the cochlea with the bony shell removed to expose the organ of Corti. The image is an extended depth projection of 11 individual confocal sections acquired 10 μm apart. Concentric rings of different colors (red, green, yellow) correspond to specific cellular staining of the organ of Corti in which structures were stained by the two fluorescent dyes with varying intensity. The even red band is comprised of the OHCs, outside is an irregular red band of HeCs, and inside is a green band of pillar cells. The inner red ring is made up by nerve fibers of the auditory nerve. Magnification, 52×.
Fig. 6.
Fig. 6.
a, Sound-induced displacement of DC and HeCs. Two superimposed sections acquired before (green) and after (red) sound exposure. Where the two sections match, the image isyellow. Magnification, 355×. b, Drawing of cell profiles in Figure 6a. Sensory cells areshaded. The colored region to theright illustrates the motion as displayed by thered and green profiles. Thearrow indicates the direction of displacement during sound exposure. OHC1, OHC2,OHC3, Outer hair cells 1, 2, and 3, respectively;IP, inner pillar cell; OP, outer pillar cell; D1, D2, D3, Deiters’ cells 1, 2, and 3, respectively.
Fig. 7.
Fig. 7.
Temporary structural displacement and sensitivity loss. The top shows the position of a lipid droplet in a HeC. A negative value corresponds to motion in the direction of thearrow in Figure 6b. After each of the three sound exposures, indicated by the bars, the structure had moved in this direction. During a period of recovery, the lipid droplet returned back toward its original position. Thebottom shows that a reversible loss of sensitivity of the cochlear microphonic potential occurred in parallel.
Fig. 8.
Fig. 8.
Structural effects of sound exposure. Images obtained before and after sound exposure for the membrane (a, b) and the enzyme (c,d) dyes. The reconstruction is the same as seen in Figure 5, but here the two dyes (recorded in separate channels) are separated. The physiological effect on this organ is illustrated in Figure 12. At the end of the experiment, the organ was fixed and examined using light microscopy, as shown in Figure 9. Magnification, 390×.
Fig. 9.
Fig. 9.
Montage demonstrating the distribution of structural damage caused by noise exposure. The preparation is the same as that presented in Figures 5, 8, and 12. a, Schematic drawing of the coils of the guinea pig cochlea with millimeter distances from the base (0) marked with points. The uppermost coil of the cochlea, the gray shaded area in the 18–19 mm region, is available for observation during an experiment in the confocal microscope. b, The organ was fixed, and the coil corresponding to the 18–19 mm shaded region shown in a was excised and examined with Nomarski interference contrast microscopy (compare c–f). LSCM images were acquired in region 1, which is the same region from where the reconstructions shown in Figures 5 and 8 were obtained. The region is seen at two different focal planes in c andd. Swollen OHCs of the second and third row are seen ind. e, The number of damaged cells was larger in region 2, which was situated on the high-frequency side of the point of observation. f, Region 3 was undamaged. TM, Tympanic membrane; P, pillar cell. Magnification:b, 47×; c–f, 423×.
Fig. 10.
Fig. 10.
Iso-response curves for the cochlear microphonic potential (see Material and Methods) show loss of sensitivity in the high-frequency region and a shift of best frequency toward lower frequency after sound exposure.
Fig. 11.
Fig. 11.
Long-term position shift and sensitivity loss. In this preparation, the structural recovery took 60 min, whereas the microphonic potential recovered only partially during this time period.
Fig. 12.
Fig. 12.
Sustained sensitivity loss. In this organ, there was no noticeable structural change or loss of cochlear microphonic sensitivity after the first three sound exposures. After the fourth exposure, a strong response is seen, with loss of electrophysiological sensitivity, a displacement of the lipid granule, and a shortening of the OHCs (indicated in the top as negative position).

Similar articles

Cited by

References

    1. Borg E, Canlon B, Engström B. Noise induced hearing loss: literature review and experiments in rabbits. Scand Audiol. 1995;24:1–147. - PubMed
    1. Brundin L, Flock B, Flock Å. Sound induced displacement responses of the guinea pig hearing organ and its relation to the cochlear potentials. Hear Res. 1992;58:175–184. - PubMed
    1. Canlon B. Acoustic overstimulation alters the morphology of the membrana tectoria. Hear Res. 1987;30:127–134. - PubMed
    1. Cody AR, Russell IJ. OHCs in the mammalian cochlea and noise-induced hearing loss. Nature. 1985;315:662–665. - PubMed
    1. Dulon D, Blanchet C, Laffon E. Photo-released intracellular Ca2+ evokes reversible mechanical responses in supporting cells of the guinea pig organ of Corti. Biochem Biophys Res Commun. 1994;3:1263–1269. - PubMed

Publication types