. 1999 Jun 1;19(11):4595-608.
doi: 10.1523/JNEUROSCI.19-11-04595.1999.

Spatiotemporal analysis of local field potentials and unit discharges in cat cerebral cortex during natural wake and sleep states

Affiliations

Spatiotemporal analysis of local field potentials and unit discharges in cat cerebral cortex during natural wake and sleep states

A Destexhe et al. J Neurosci. .

Abstract

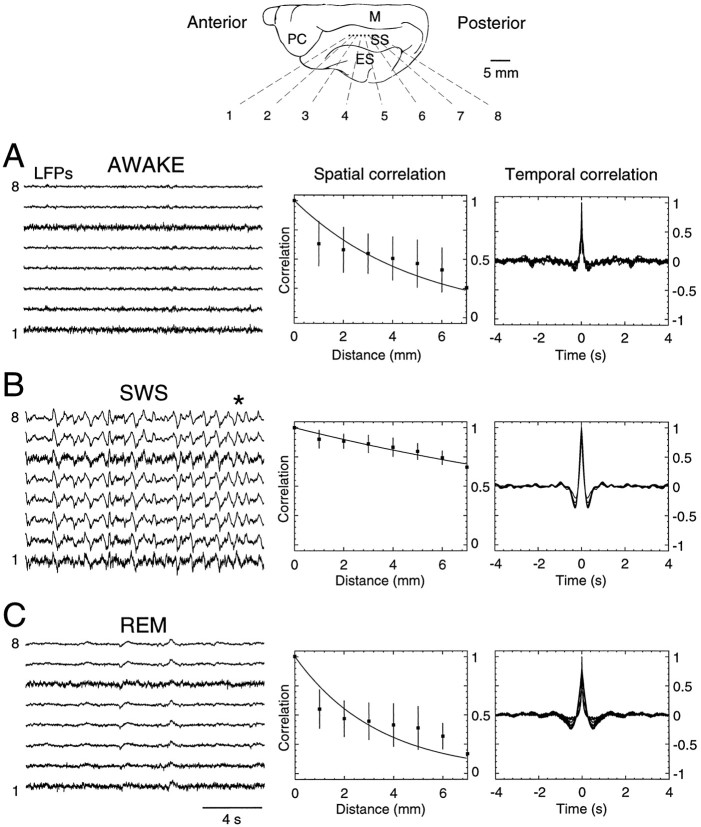
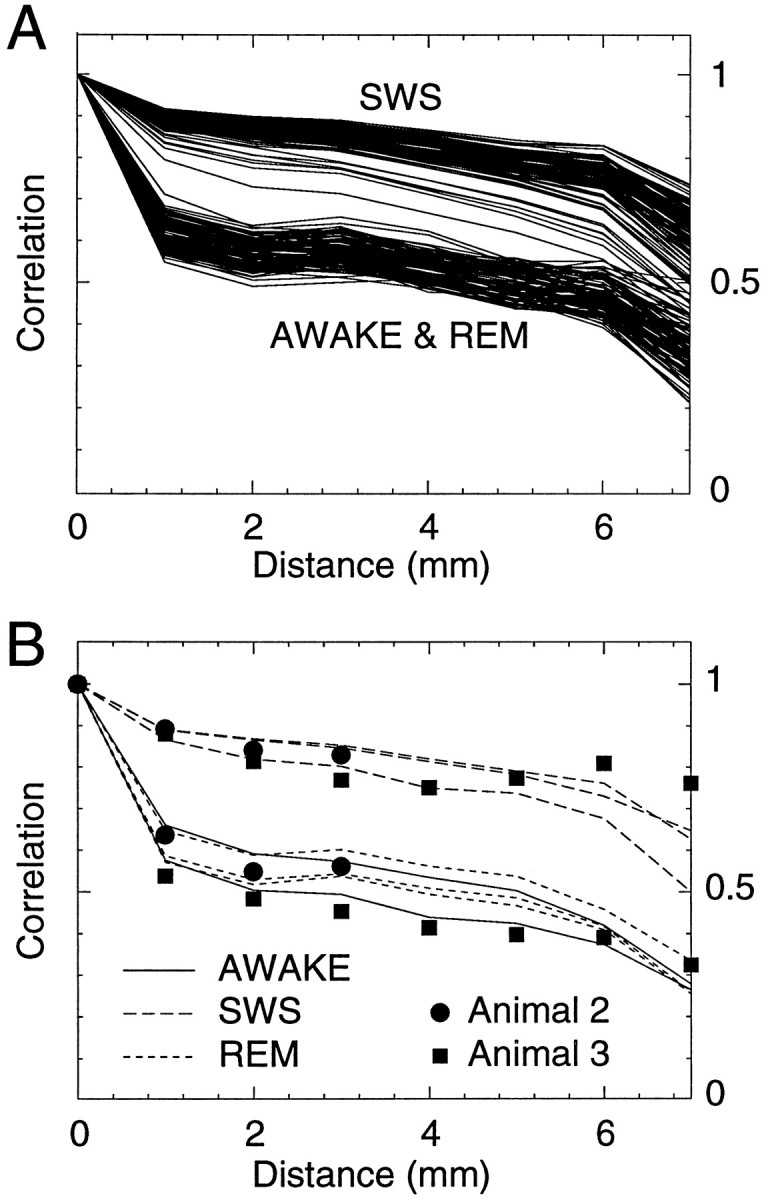
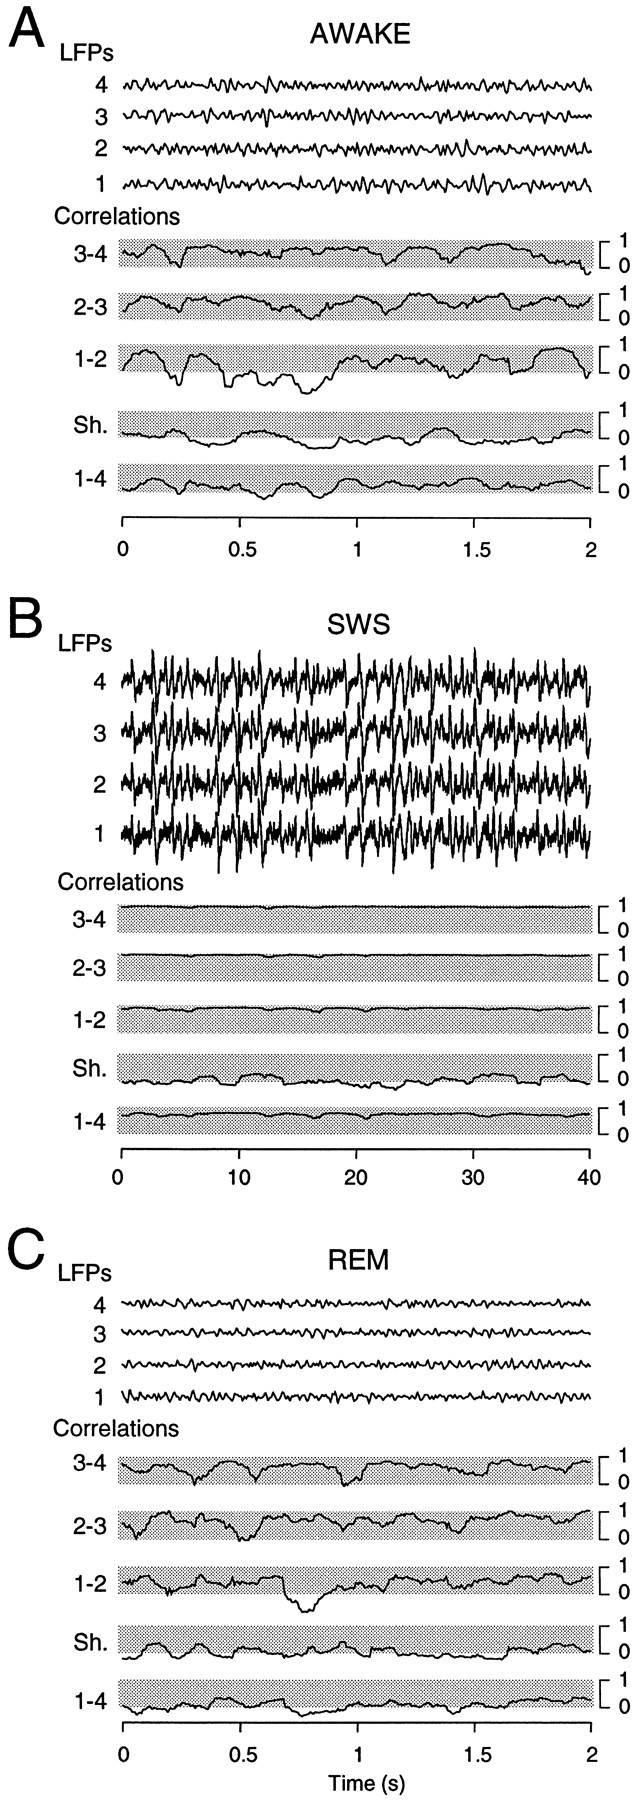
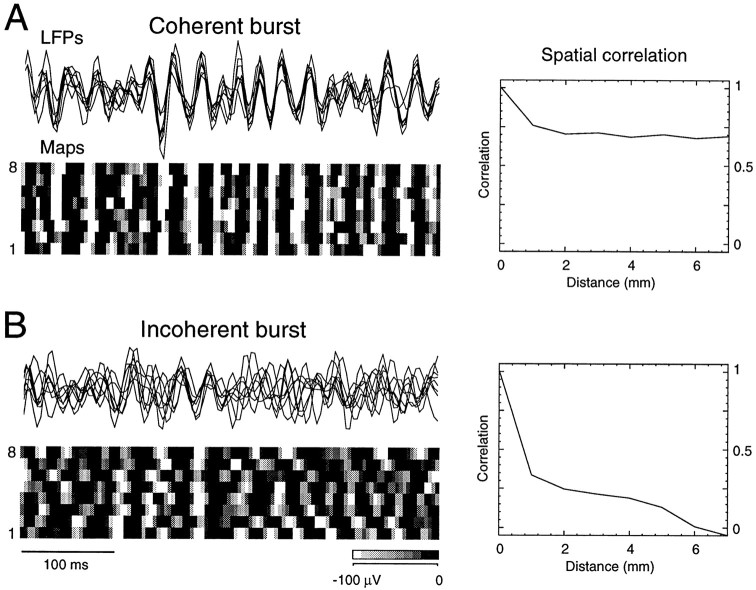
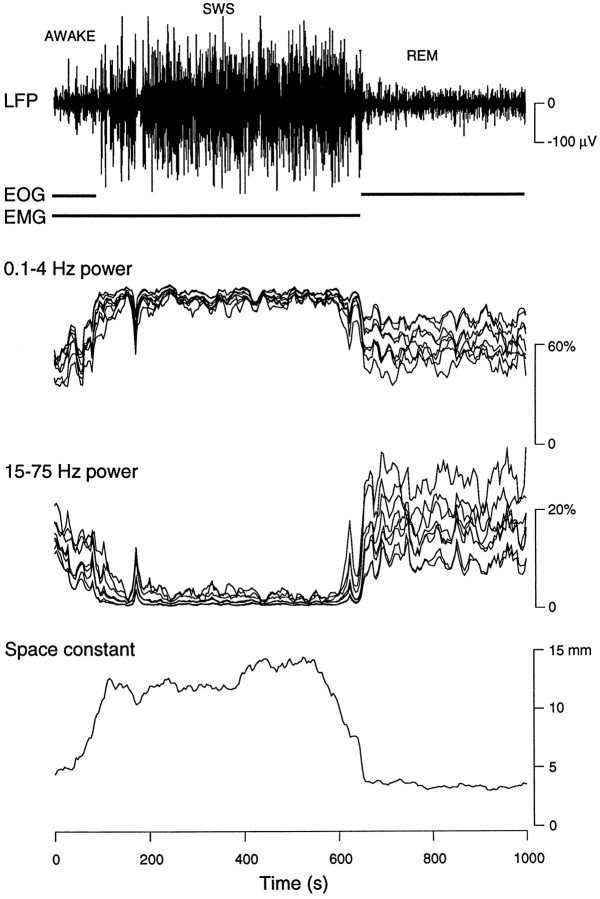
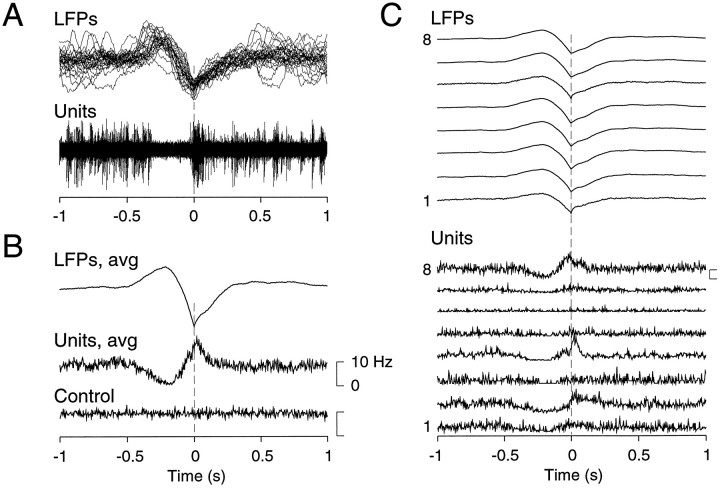
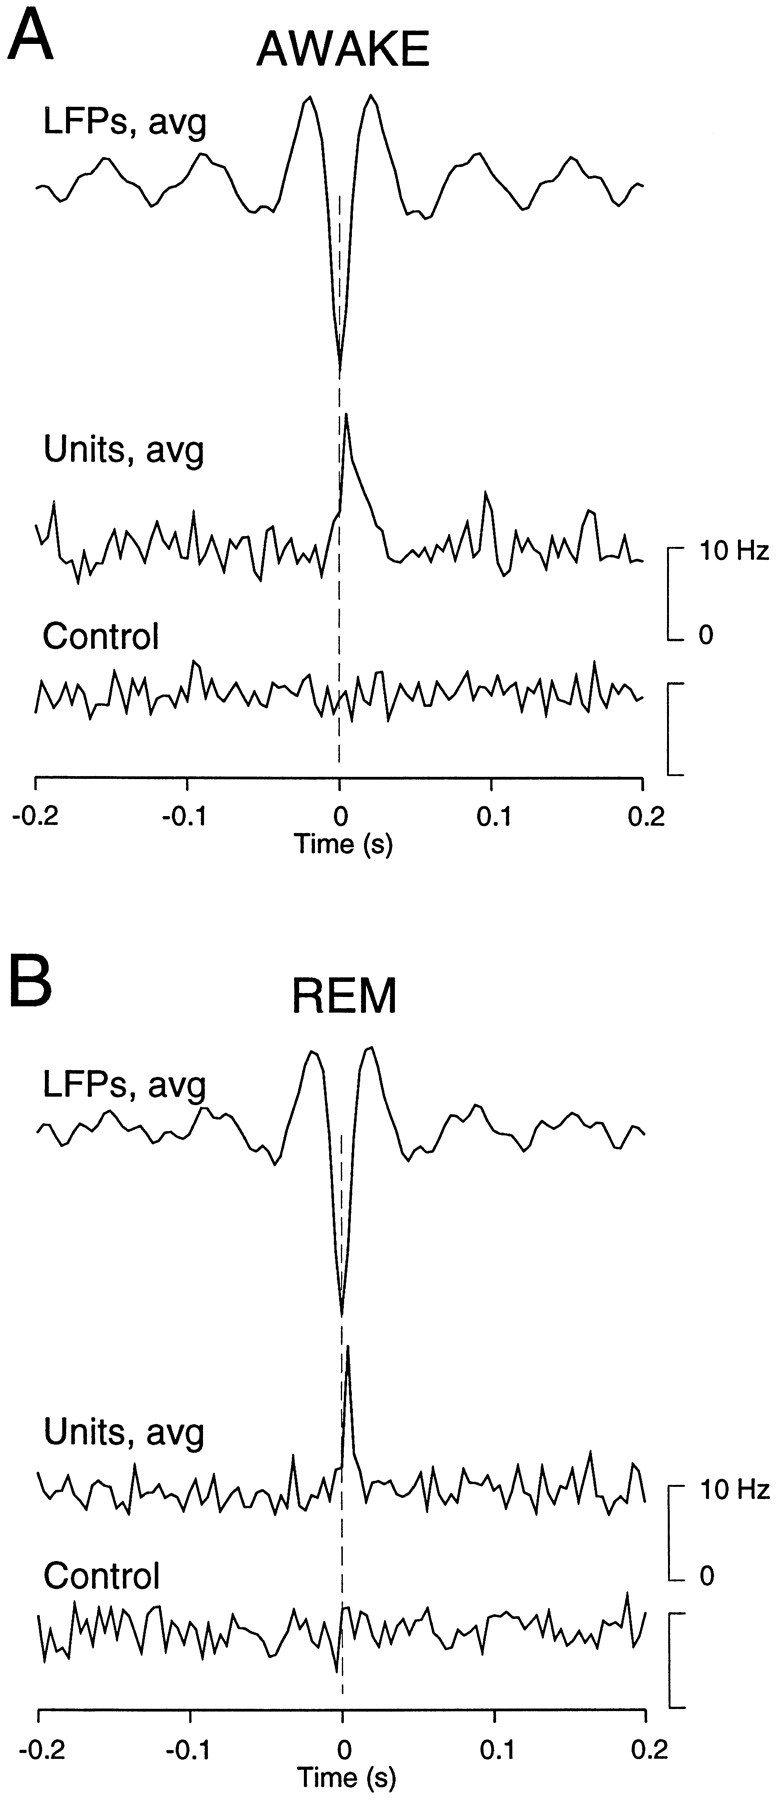
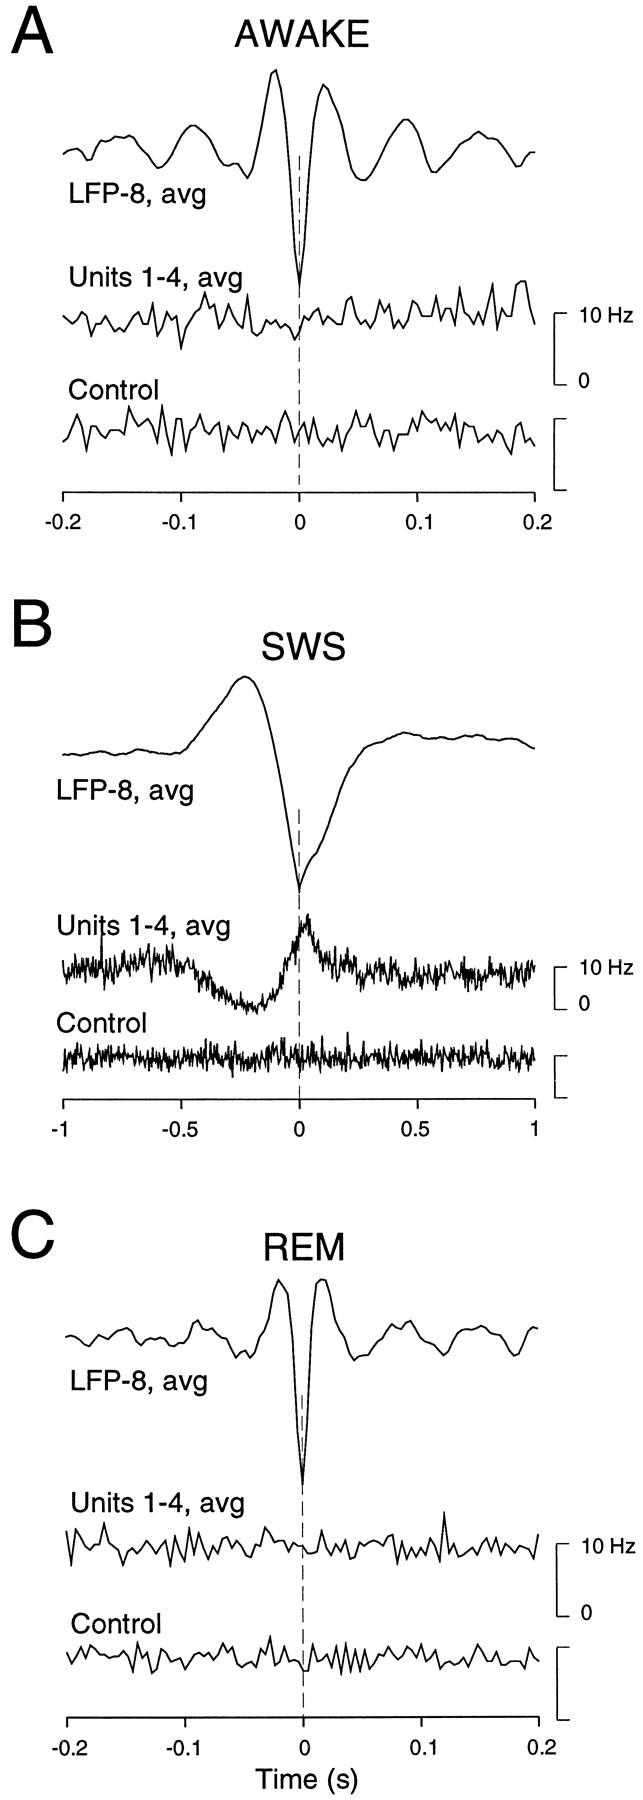
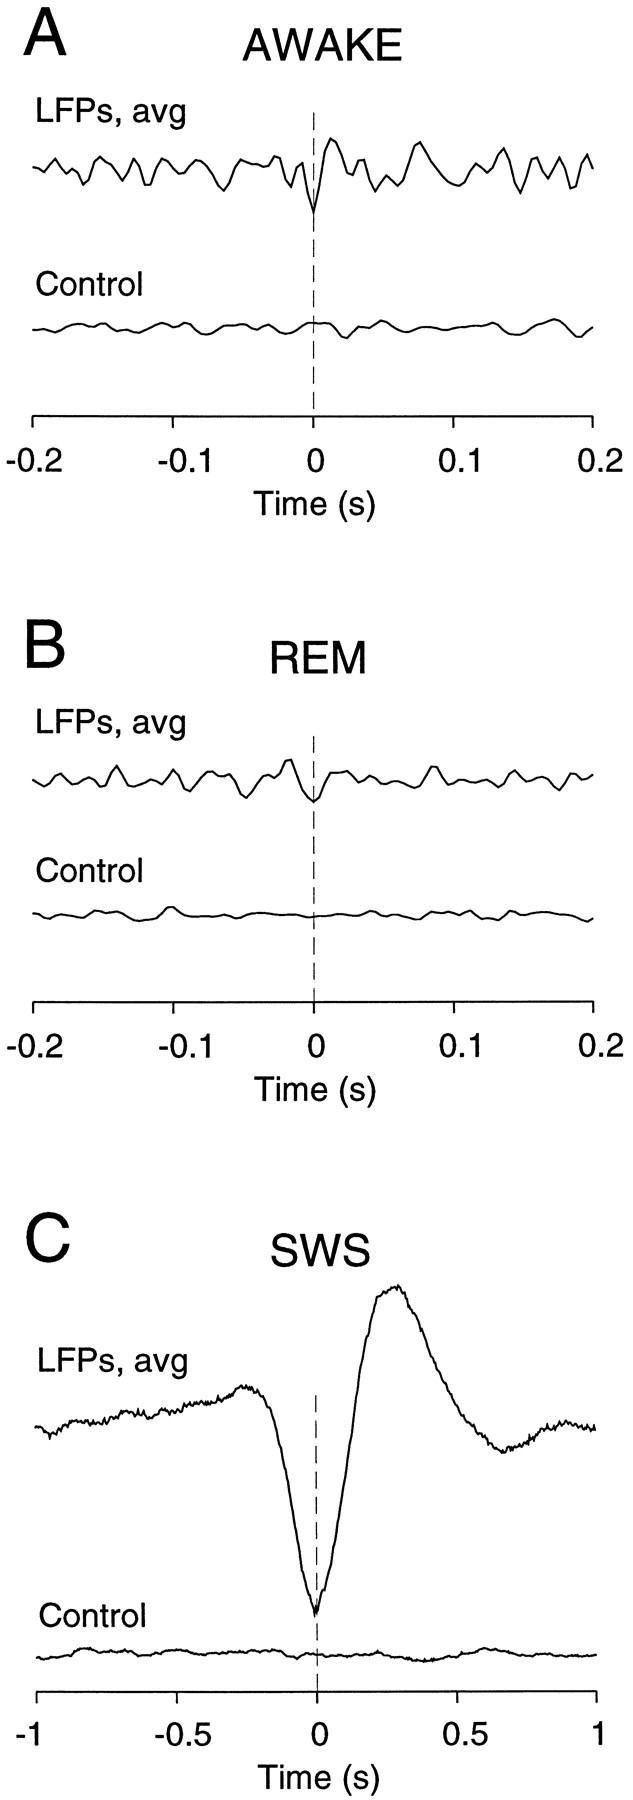
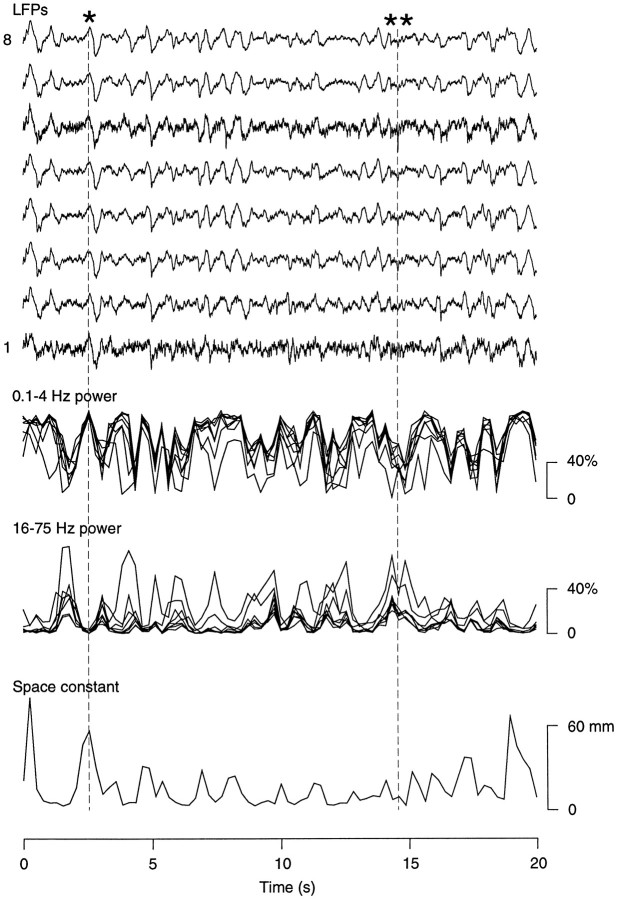
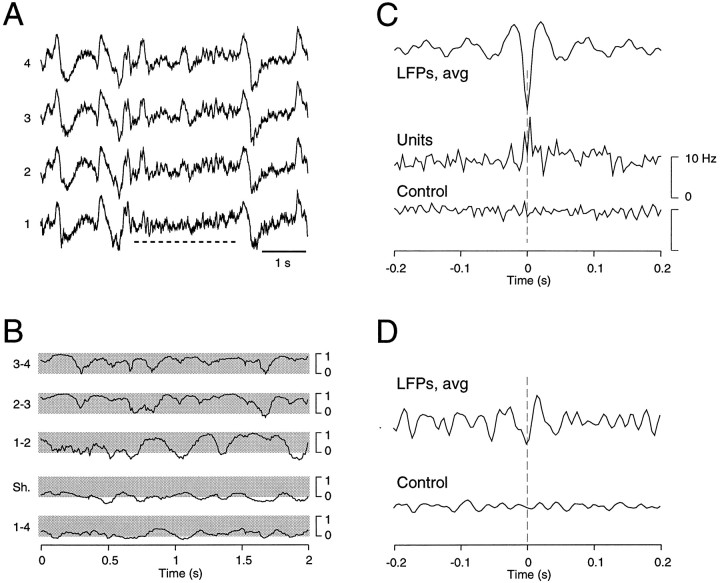
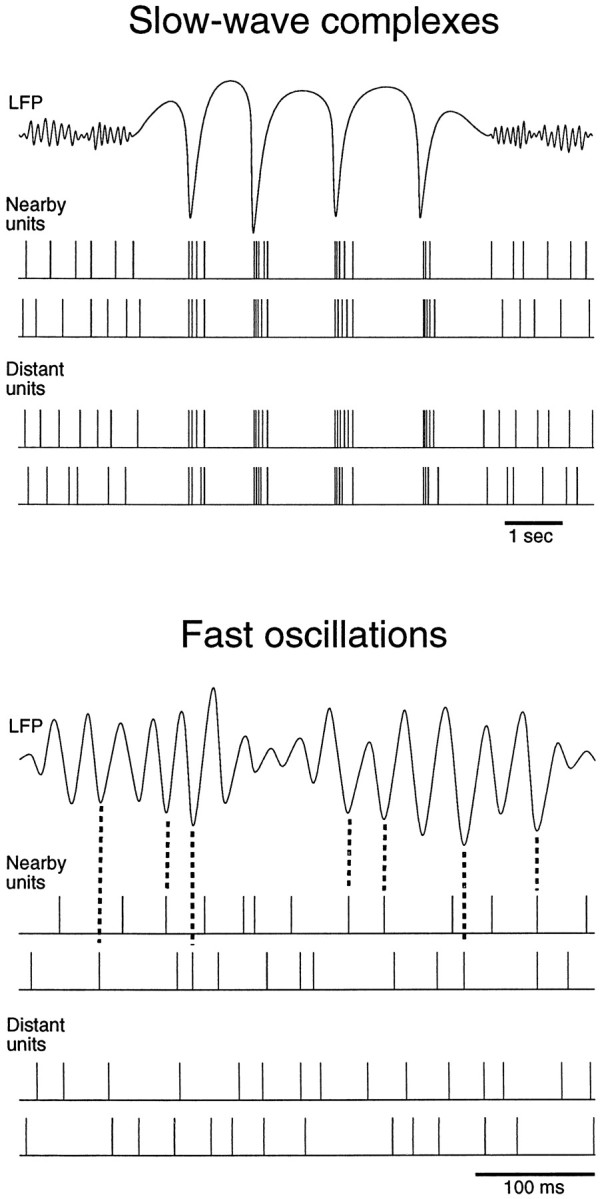
The electroencephalogram displays various oscillation patterns during wake and sleep states, but their spatiotemporal distribution is not completely known. Local field potentials (LFPs) and multiunits were recorded simultaneously in the cerebral cortex (areas 5-7) of naturally sleeping and awake cats. Slow-wave sleep (SWS) was characterized by oscillations in the slow (<1 Hz) and delta (1-4 Hz) frequency range. The high-amplitude slow-wave complexes consisted in a positivity of depth LFP, associated with neuronal silence, followed by a sharp LFP negativity, correlated with an increase of firing. This pattern was of remarkable spatiotemporal coherence, because silences and increased firing occurred simultaneously in units recorded within a 7 mm distance in the cortex. During wake and rapid-eye-movement (REM) sleep, single units fired tonically, whereas LFPs displayed low-amplitude fast activities with increased power in fast frequencies (15-75 Hz). In contrast with the widespread synchronization during SWS, fast oscillations during REM and wake periods were synchronized only within neighboring electrodes and small time windows (100-500 msec). This local synchrony occurred in an apparent irregular manner, both spatially and temporally. Brief periods (<1 sec) of fast oscillations were also present during SWS in between slow-wave complexes. During these brief periods, the spatial and temporal coherence, as well as the relation between units and LFPs, was identical to that of fast oscillations of wake or REM sleep. These results show that natural SWS in cats is characterized by slow-wave complexes, synchronized over large cortical territories, interleaved with brief periods of fast oscillations, characterized by local synchrony, and of characteristics similar to that of the sustained fast oscillations of activated states.


Figures

Fig. 1.
Fig. 1.
Multisite local field potentials in cat cerebral cortex during natural wake and sleep states. Top, Eight bipolar electrodes (interelectrode distance of 1 mm) were inserted into the depth (1 mm) of areas 5–7 of cat neocortex. ES, Ectosylvian gyrus; M, marginal gyrus; PC, postcruciate gyrus; SS, suprasylvian gyrus. LFPs (LFPs), the decay of correlation with distance (Spatial correlation), and autocorrelations (Temporal correlation) are shown for three different states. A, During the wake state (AWAKE), LFPs were characterized by low-amplitude fast activities in the β–γ frequency range (15–75 Hz). Correlations decayed steeply with distance and time. B, During SWS, the LFPs were dominated by large-amplitude slow-wave complexes recurring at a slow frequency (< 1 Hz) and displaying high coherence. Slow-wave complexes of higher frequency (1–2 Hz) were also present and displayed more moderate coherence (asterisk). Correlations stayed high for large distances (Spatial correlation) but decayed steeply with time (Temporal correlation).C, During REM sleep, LFPs and correlations had characteristics similar to those during wake periods.
Fig. 2.
Fig. 2.
Spatial correlations during wake and sleep states.A, Stationarity of spatial correlations in a 2 hr recording in the same animal. Each solid line represents the correlations calculated in consecutive windows of 20 sec in a total recording time of 2 hr. Wake and REM periods were indistinguishable, but SWS displayed significantly higher correlations. B, Spatial correlations calculated from long periods of time in different animals. Lines indicate several periods of wake, SWS, and REM sleep in the same animal (length of each period, 2.5 and 15 min for wake state; 11, 15, and 17 min for SWS; and 3, 8, and 10 min for REM). The symbols indicate the spatial correlations obtained for two other animals (squares, 5 min of SWS and 4 min of wake; circles, 8 min of SWS and 4 min of REM). All data sets were obtained using the eight-electrode setup shown in the top of Figure 1, except for the data set shown bycircles that was obtained with four electrodes (interelectrode distance of 1 mm in all cases).
Fig. 3.
Fig. 3.
Fast oscillations are coherent locally in space and time. LFP recordings in the suprasylvian gyrus (LFPs; locations similar to that of electrodes 1–4 in Fig. 1, with a 1 mm interelectrode distance) are shown together with the maximal cross-correlation (Correlations) calculated between pairs of electrodes (1–2, 2–3, 3–4, and 1–4 pairs)Sh., The control correlation obtained between electrode 1 and the same signal taken 20 sec later. A, Fast oscillations during wake periods. Neighboring electrodes were occasionally synchronized, as shown by correlations close to 1, but only for short periods of time (100–500 msec). B, Period of slow-wave sleep with the number of oscillation cycles similar to that in A (note the difference in the time scale). In this case, correlations between neighboring electrodes stayed close to unity, and the synchrony extended the entire recorded area.C, Period of REM sleep. Fast oscillations had a dynamics similar to that in A, consisting in brief periods of synchrony between neighboring electrodes, occurring irregularly and within short time windows. Correlations were calculated in successive time windows of 100 msec for A and C and 2 sec for B.
Fig. 4.
Fig. 4.
Fast oscillations are occasionally coherent across large cortical distances. LFPs from eight recording electrodes are shown during fast oscillations (LFPs; signal filtered between 15 and 75 Hz). Spatiotemporal maps for the same period of activity are shown below the recordings (Maps). Spatiotemporal maps were constructed by representing space (y-axis) and voltage (gray level) against time (x-axis). Thegray scale ranged from white (−100 μV and below) to black (0 μV and above) in 10 levels. The correlation decay with distance calculated during the same period of time is shown on the right (Spatial correlation). A, Coherent burst, Fast oscillations were occasionally synchronized across large distances, as shown by the vertical blackwhite stripes in the spatiotemporal maps and the high values of correlations at a 7 mm distance. This coherent burst was recorded during REM sleep. B, Incoherent burst, In most instances, synchrony was present only between neighboring electrodes and during restricted time windows (as shown in Fig. 3). This local synchrony of fast oscillations can also be seen by the local patterns of black–white stripes in the spatiotemporal maps. In this case, correlations decayed steeply with distance. The latter type of activity represents the pattern observed most frequently during wake and REM periods.
Fig. 5.
Fig. 5.
Spatial coherence during the transition between wake and sleep states. Top, The depth LFP recorded in the suprasylvian gyrus during a period of 16 min, consisting of ∼2 min of wake followed by ∼8 min of SWS and ∼6 min of REM sleep, is shown. The presence of ocular movements (EOG) and of muscular tonus (EMG) were monitored and are indicated by horizontal bars. Middle, The relative power of 0.1–4 and 15–75 Hz frequency bands are represented during the same period at eight different cortical sites (as shown in the top of Fig. 1). Bottom, The space constant of the decay of correlations with distance is shown. SWS activity is characterized by a marked increase of spatial coherence compared with that of wake and REM periods. Power spectra and spatial correlations were calculated in successive windows of 16.4 sec (4096 points).
Fig. 6.
Fig. 6.
Relation between simultaneously recorded multiunit discharges and field potentials during slow-wave complexes.A, Individual slow-wave complexes were detected numerically during SWS and were aligned with respect to the negative peak of the LFPs (LFPs). The multiunit discharges detected in the same electrode were aligned similarly (Units). B, Wave-triggered averages of field potentials and multiunit discharges are shown. The averaged field potentials (LFPs, avg) were constructed by averaging the LFP over the eight electrodes and over 210 detected slow-wave complexes. The resulting averaged LFP consisted in a slow positivity followed by a sharp negativity. The corresponding multiunit discharges were averaged similarly (Units,avg) and displayed a drop of firing rate correlated with LFP positivity, followed by an increase of firing during the LFP negativity. The same wave-triggered average did not show any modulation of firing rate if performed on randomly shuffled spikes (Control). C, Spatial profile of the relation between units and LFPs is presented. Local field potentials, averaged over 210 slow-wave complexes, are shown for each electrode (LFPs). The corresponding wave-triggered averages of multiunit discharge at each electrode are shown (Units). Slow-wave complexes consisted in a widespread drop of firing, correlated with LFP positivity, followed by a synchronized increase of firing, correlated with LFP negativity. These events were synchronous over the entire extent of the cortical area recorded (7 mm). Data in AC are from the same animal.
Fig. 7.
Fig. 7.
Relation between simultaneously recorded multiunit discharges and field potentials during fast oscillations of wake and REM sleep. A, Relation between local field potentials (LFPs, avg) and multiunit discharges (Units, avg) in periods of wake. Signals were filtered between 15 and 75 Hz, and the peak negativities of field potentials were detected. The LFP waveform shown was obtained by averaging over a total of 467 detected events from eight electrodes. The corresponding wave-triggered average of multiunit discharges displayed a marked increase of firing correlated with the LFP negativity. The same analysis performed on randomly shuffled spikes did not show any pattern (Control). B, Same analysis during periods of REM sleep in the same animal. In this analysis, 1721 detected events were used to compute the averaged LFP. During REM sleep, similar to wake states, cells tended to fire in relation with the negativity of the field potentials during fast oscillations, whereas no increase of firing was seen in the control. Data in A and B are from the same animal.
Fig. 8.
Fig. 8.
Correlations over large distances are present during slow-wave sleep but not during wake or REM sleep. Wave-triggered averages were computed from LFPs and from cells at a distance of >4 mm. LFP negativities from electrode 8 (LFP-8,avg) were detected to average units from electrodes 1 to 4 (Units 1–4, avg; the same procedures that were used in wave-triggered averages and the same data as in Fig.6 for SWS and Fig. 7 for wake and REM sleep). A, In periods of wake, there was no visible relation betweenLFP-8 and units 1–4. B, During SWS in the same animal, the positivity/negativity complex was correlated with a decrease/increase of firing in units.C, No detectable relation was seen for REM sleep (same animal), similar to results in A. All control traces display the same procedure based on randomly shuffled spikes.
Fig. 9.
Fig. 9.
Relation between extracellular unit discharges and local field potentials as detected from spike events. Spike-triggered averages of local field potentials were first computed at each individual electrode. These spike-triggered averages were then averaged to yield a single curve, shown here for various states.A, In wake states, individual spikes were correlated with the negativity of the local field potentials (LFPs,avg; 5506 spikes processed). B, A similar relation was obtained during REM sleep (LFPs,avg; 19491 spikes processed). C, During slow-wave sleep, the average LFP events corresponding to spikes consisted of a broad negative deflection, followed by a slow positive deflection (LFPs, avg; 34244 spikes processed; note different time scale). In all cases, the same analysis based on randomly shuffled spikes did not evidence any preferred pattern (Control).
Fig. 10.
Fig. 10.
Fine structure of local field potentials during slow-wave sleep. The LFPs at eight cortical sites (top curves; same experiment described in Fig. 1), the relative power of low-frequency (0.1–4 Hz) and fast-frequency (16-75 Hz) components (middle curves), and the space constant of correlation decay with distance (bottom curve) are shown for a 20 sec period of slow-wave sleep. Power spectra and spatial correlations were calculated in successive windows of 0.512 sec (128 points). Slow-wave complexes (single asterisk) were synchronous over the eight electrodes, whereas brief periods of fast oscillations (double asterisks) had lower spatial coherence.
Fig. 11.
Fig. 11.
Fast oscillations during slow-wave sleep have characteristics similar to that during wake and REM sleep.A, A brief period of fast oscillations (dashed horizontal line) during slow-wave sleep. B, Dynamics of correlations during the period of fast oscillations shown in A, analyzed similarly as described in Figure 3. Fast oscillations displayed local patterns of synchrony, within short time windows and between neighboring electrodes, similar to that of wake and REM periods. C, Relation between neuronal firing and local field potentials. Slow-wave complexes were artificially removed from LFPs in a period of 11 min of slow-wave sleep. The corresponding spikes were also removed from multiunit discharges. The resulting LFPs and multiunit discharges were then analyzed similarly as described in Figure 7 (390 events processed). The wave-triggered averaging procedure shows that the negative LFP of fast oscillations of SWS (LFPs, avg) was correlated with an increase of firing (Units). The same analysis based on randomly shuffled spikes did not show any pattern (Control). D, Spike-triggered averages calculated similarly as described in Figure 9 (4011 spikes processed). Spikes were correlated with the LFP negativity of fast oscillations (LFPs, avg), similar to that of wake and REM sleep, but did not show any preferred pattern if spikes were randomly shuffled (Control).
Fig. 12.
Fig. 12.
Schematic representation of the relationship between local field potentials and unit discharges during wake and sleep states. Top, During slow-wave sleep, slow-wave complexes were correlated with phasic-firing activity. Periods of neuronal silence coincided with depth positivity in the LFP, whereas depth-negative components occurred in coincidence with increased firing in units. The occurrence of periods of decreased and increased firing was synchronous over large cortical distances (>7 mm).Bottom, During fast oscillations, units discharged more tonically, with an increased probability of firing during the depth-negative component of the LFP. The coherence extended over short distances (∼1–2 mm), and unit activity was correlated only with the nearby LFP. This pattern was seen for fast oscillations of wake and REM sleep, as well as for brief periods of fast oscillations occurring during SWS.

Similar articles

Cited by

References

    1. Achermann P, Borbély AA. Low-frequency (<1 Hz) oscillations in the human sleep electroencephalogram. Neuroscience. 1997;81:213–222. - PubMed
    1. Achermann P, Borbély AA. Coherence analysis of the human sleep electroencephalogram. Neuroscience. 1998;85:1195–1208. - PubMed
    1. Amzica F, Steriade M. Disconnection of intracortical synaptic linkages disrupts synchronization of a slow oscillation. J Neurosci. 1995;15:4658–4677. - PMC - PubMed
    1. Amzica F, Steriade M. The K-complex: its slow (<1 Hz) rhythmicity and relation to delta waves. Neurology. 1997;49:952–959. - PubMed
    1. Ball CJ, Gloor P, Schaul N. The cortical electromicrophysiology of pathological delta waves in the electroencephalogram of cats. Electroencephalogr Clin Neurophysiol. 1977;43:346–361. - PubMed

Publication types

LinkOut - more resources