

The immune suppressive effect of dexamethasone in rheumatoid arthritis is accompanied by upregulation of interleukin 10 and by differential changes in interferon gamma and interleukin 4 production
- PMID: 10343540
- PMCID: PMC1752750
- DOI: 10.1136/ard.58.1.49
The immune suppressive effect of dexamethasone in rheumatoid arthritis is accompanied by upregulation of interleukin 10 and by differential changes in interferon gamma and interleukin 4 production
Abstract
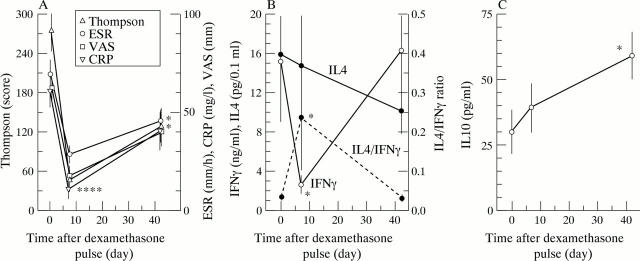
Objectives: The influence of dexamethasone on interleukin 10 (IL10) production and the type 1 (T1)/type 2 (T2) T cell balance found in rheumatoid arthritis (RA) was studied.
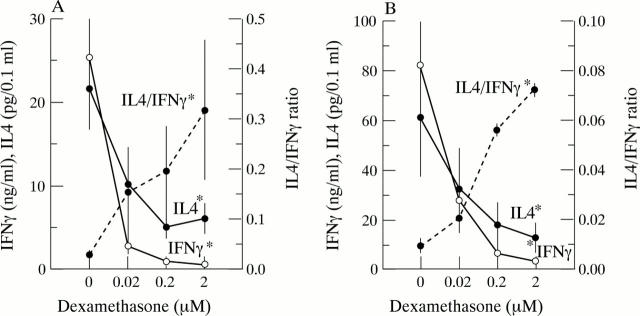
Methods: Peripheral blood mononuclear cells (PB MNC) were isolated from 14 RA patients both before and 7 and 42 days after high dose dexamethasone pulse therapy. The ex vivo production of IL10, interferon gamma (IFN gamma) (T1 cell), and IL4 (T2 cell) by PB MNCs was assessed, along with parameters of disease activity (erythrocyte sedimentation rate, C reactive protein, Visual Analogue Scale, Thompson joint score). In addition, the in vitro effect of dexamethasone (0.02, 0.2, and 2 microM) on PB MNC IL10, IFN gamma, and IL4 production was studied.
Results: Dexamethasone pulse therapy resulted in a rapid and sustained decrease in RA disease activity. IL10 production increased after dexamethasone treatment and this was sustained for at least six weeks. A transient strong decrease in IFN gamma was seen shortly after corticosteroid treatment, while IL4 only decreased slightly. This led to an increased IL-4/IFN gamma ratio. In vitro, IL10 production was not detectable, IFN gamma and IL4 decreased, but the effect was more pronounced for IFN gamma than for IL4, which again resulted in an increased IL4/IFN gamma ratio.
Conclusion: Dexamethasone therapy in RA patients leads to a rapid, clinically beneficial effect. The upregulation of IL10 production may be involved in the prolonged clinical benefit. The strong immunosuppressive effect is most evident in the decrease in IFN gamma, and is therefore accompanied by a relative shift towards T2 cell activity. In vitro evaluation showed that this shift in T cell balance was a direct effect of dexamethasone and thus independent of the hypothalamic-pituitary-adrenal axis.
Figures
Similar articles
-
Decrease in peripheral type 1 over type 2 T cell cytokine production in patients with rheumatoid arthritis correlates with an increase in severity of disease.Ann Rheum Dis. 1997 Nov;56(11):656-60. doi: 10.1136/ard.56.11.656. Ann Rheum Dis. 1997. PMID: 9462167 Free PMC article.
-
Effects of dexamethasone on lymphocyte proliferation and cytokine production in rheumatoid arthritis.J Rheumatol. 2002 Jan;29(1):46-51. J Rheumatol. 2002. PMID: 11824970
-
Interleukin 10 (IL-10), not IL-4 or interferon-gamma production, correlates with progression of joint destruction in rheumatoid arthritis.J Rheumatol. 2001 Sep;28(9):1960-6. J Rheumatol. 2001. PMID: 11550960
-
Mutual antagonism of rheumatoid arthritis and hay fever; a role for type 1/type 2 T cell balance.Ann Rheum Dis. 1998 May;57(5):275-80. doi: 10.1136/ard.57.5.275. Ann Rheum Dis. 1998. PMID: 9741310 Free PMC article.
-
Effect of treatment of rheumatoid arthritis with infliximab on IFN gamma, IL4, T-bet, and GATA-3 expression: link with improvement of systemic inflammation and disease activity.Ann Rheum Dis. 2005 Mar;64(3):415-8. doi: 10.1136/ard.2004.022731. Epub 2004 Jul 29. Ann Rheum Dis. 2005. PMID: 15286007 Free PMC article.
Cited by
-
Dexamethasone-Activated MSCs Release MVs for Stimulating Osteogenic Response.Stem Cells Int. 2018 Apr 16;2018:7231739. doi: 10.1155/2018/7231739. eCollection 2018. Stem Cells Int. 2018. PMID: 29760734 Free PMC article.
-
Interleukin-10 promoter polymorphism in patients with rheumatoid arthritis.Clin Rheumatol. 2005 Sep;24(5):480-4. doi: 10.1007/s10067-004-1066-5. Epub 2005 May 25. Clin Rheumatol. 2005. PMID: 15915323
-
Effect of Scoparia dulcis on noise stress induced adaptive immunity and cytokine response in immunized Wistar rats.J Ayurveda Integr Med. 2017 Jan-Mar;8(1):13-19. doi: 10.1016/j.jaim.2016.10.004. Epub 2017 Feb 1. J Ayurveda Integr Med. 2017. PMID: 28161157 Free PMC article.
-
Immunopathology alters Th17 cell glucocorticoid sensitivity.Allergy. 2017 Mar;72(3):331-341. doi: 10.1111/all.13051. Epub 2016 Oct 13. Allergy. 2017. PMID: 27646878 Free PMC article. Review.
-
Clinical Use and Molecular Action of Corticosteroids in the Pediatric Age.Int J Mol Sci. 2019 Jan 21;20(2):444. doi: 10.3390/ijms20020444. Int J Mol Sci. 2019. PMID: 30669566 Free PMC article. Review.
References
Publication types
MeSH terms
Substances
LinkOut - more resources
Full Text Sources
Other Literature Sources
Medical
Research Materials
