

Effect of temperature on structure and function of the methanogenic archaeal community in an anoxic rice field soil
- PMID: 10347011
- PMCID: PMC91346
- DOI: 10.1128/AEM.65.6.2341-2349.1999
Effect of temperature on structure and function of the methanogenic archaeal community in an anoxic rice field soil
Abstract
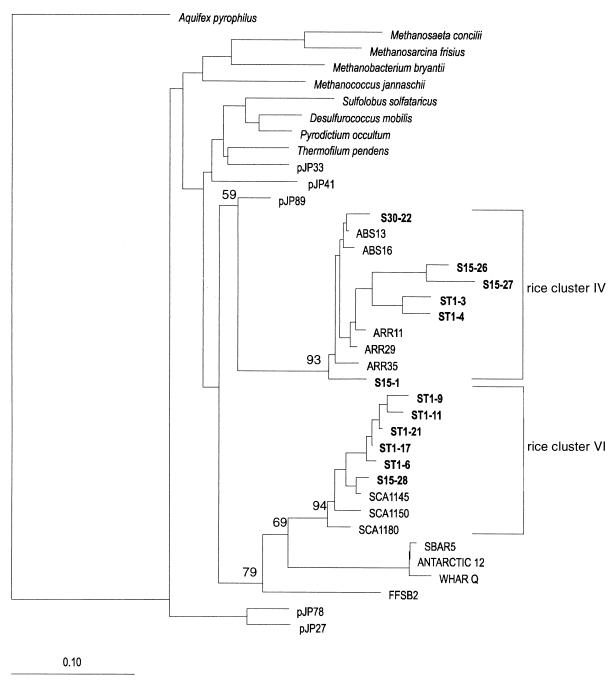
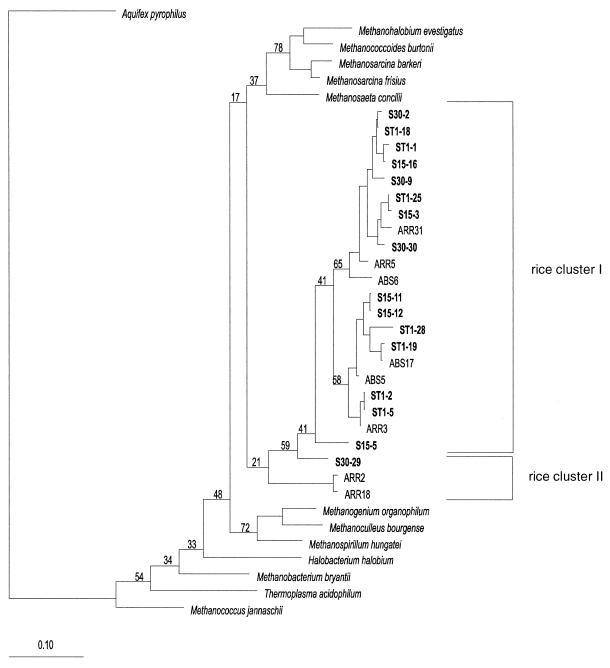
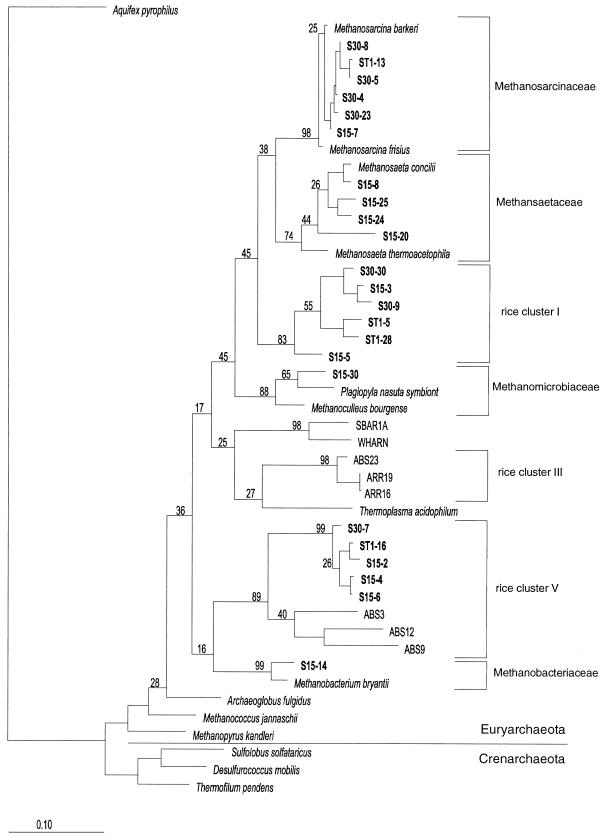
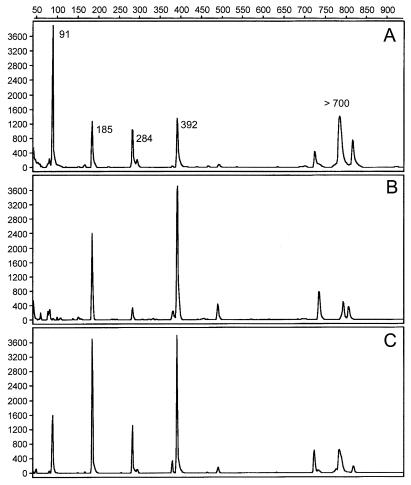
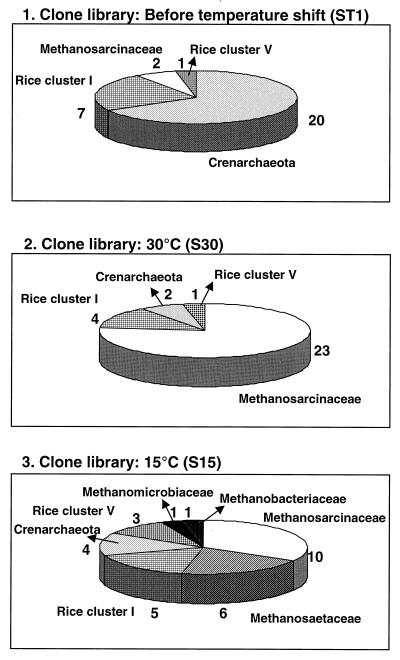
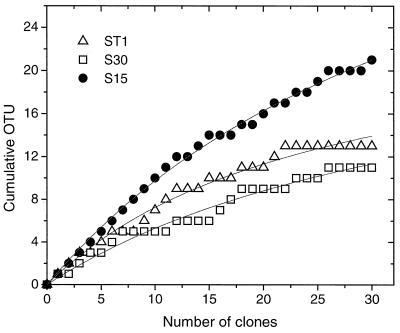
Soil temperatures in Italian rice fields typically range between about 15 and 30 degrees C. A change in the incubation temperature of anoxic methanogenic soil slurry from 30 degrees C to 15 degrees C typically resulted in a decrease in the CH4 production rate, a decrease in the steady-state H2 partial pressure, and a transient accumulation of acetate. Previous experiments have shown that these changes were due to an alteration of the carbon and electron flow in the methanogenic degradation pathway of organic matter caused by the temperature shift (K. J. Chin and R. Conrad, FEMS Microbiol. Ecol. 18:85-102, 1995). To investigate how temperature affects the structure of the methanogenic archaeal community, total DNA was extracted from soil slurries incubated at 30 and 15 degrees C. The archaeal small-subunit (SSU) rRNA-encoding genes (rDNA) of these environmental DNA samples were amplified by PCR with an archaeal-specific primer system and used for the generation of clone libraries. Representative rDNA clones (n = 90) were characterized by terminal restriction fragment length polymorphism (T-RFLP) and sequence analysis. T-RFLP analysis produced for the clones terminally labeled fragments with a characteristic length of mostly 185, 284, or 392 bp. Sequence analysis allowed determination of the phylogenetic affiliation of the individual clones with their characteristic T-RFLP fragment lengths and showed that the archaeal community of the anoxic rice soil slurry was dominated by members of the families Methanosarcinaceae (185 bp) and Methanosaetaceae (284 bp), the kingdom Crenarchaeota (185 or 284 bp), and a novel, deeply branching lineage of the (probably methanogenic) kingdom Euryarchaeota (392 bp) that has recently been detected on rice roots (R. Grosskopf, S. Stubner, and W. Liesack, Appl. Environ. Microbiol. 64:4983-4989, 1998). The structure of the archaeal community changed when the temperature was shifted from 30 degrees C to 15 degrees C. Before the temperature shift, the clones (n = 30) retrieved from the community were dominated by Crenarchaeota (70%), "novel Euryarchaeota" (23%), and Methanosarcinacaeae (7%). Further incubation at 30 degrees C (n = 30 clones) resulted in a relative increase in members of the Methanosarcinaceae (77%), whereas further incubation at 15 degrees C (n = 30 clones) resulted in a much more diverse community consisting of 33% Methanosarcinaceae, 23% Crenarchaeota, 20% Methanosaetaceae, and 17% novel Euryarchaeota. The appearance of Methanosaetaceae at 15 degrees C was conspicuous. These results demonstrate that the structure of the archaeal community in anoxic rice field soil changed with time and incubation temperature.
Figures

References
-
- Asakawa S, Hayano K. Populations of methanogenic bacteria in paddy field soil under double cropping conditions (rice-wheat) Biol Fertil Soils. 1995;20:113–117.
-
- Atlas R M, Bartha R. Microbial ecology—fundamentals and applications. 3rd ed. Redwood City, Calif: Benjamin/Cummings; 1993.
Publication types
MeSH terms
Substances
Associated data
- Actions
- Actions
- Actions
- Actions
LinkOut - more resources
Full Text Sources
Molecular Biology Databases
