

Molecular investigation of the postantibiotic effects of clarithromycin and erythromycin on Staphylococcus aureus cells
- PMID: 10348746
- PMCID: PMC89272
- DOI: 10.1128/AAC.43.6.1324
Molecular investigation of the postantibiotic effects of clarithromycin and erythromycin on Staphylococcus aureus cells
Abstract
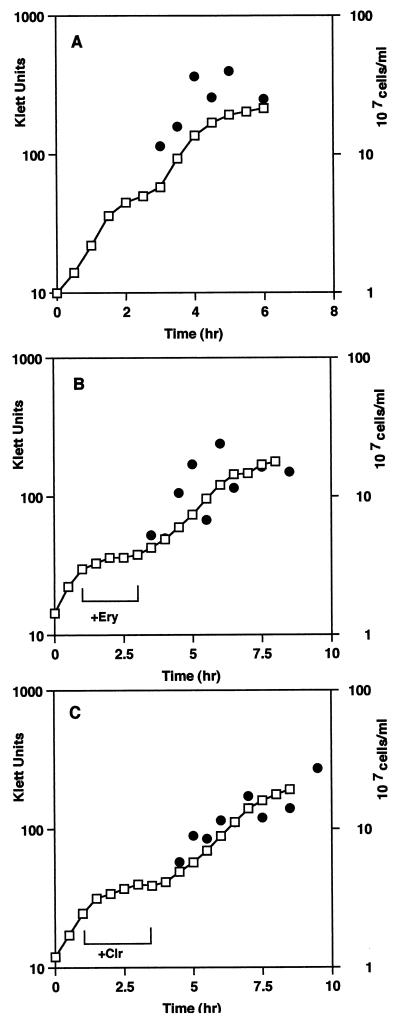
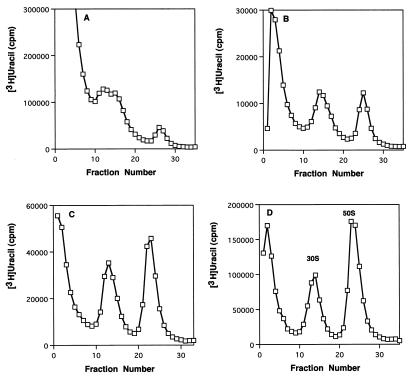
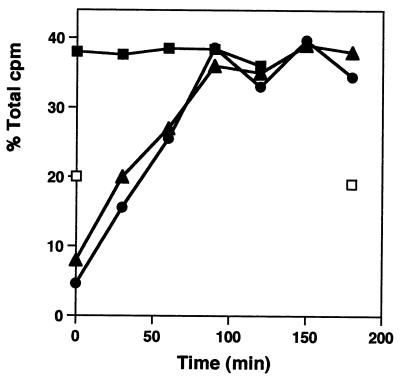
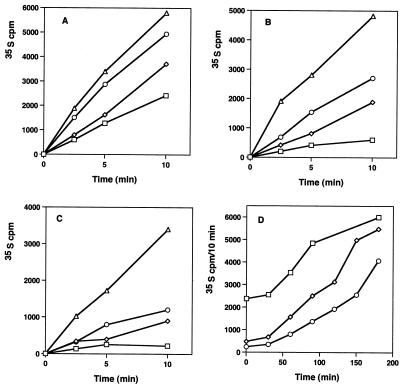
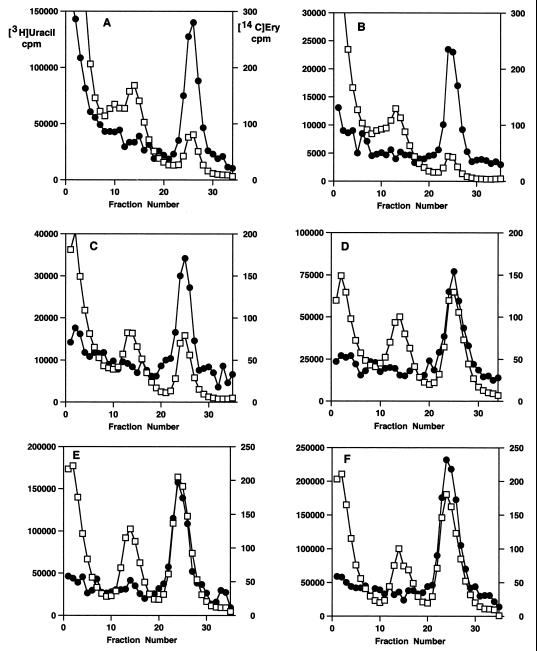
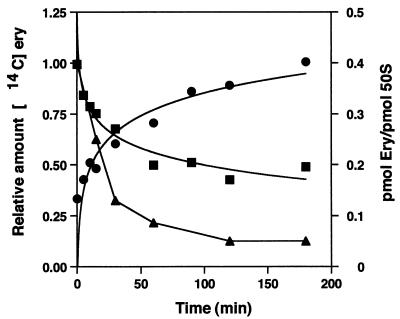
The kinetics of recovery after inhibition of growth by erythromycin and clarithromycin were examined in Staphylococcus aureus cells. After inhibition for one mass doubling by 0.5 microg of the antibiotics/ml, a postantibiotic effect (PAE) of 3 and 4 h duration was observed for the two drugs before growth resumed. Cell viability was reduced by 25% with erythromycin and 45% with clarithromycin compared with control cells. Erythromycin and clarithromycin treatment reduced the number of 50S ribosomal subunits to 24 and 13% of the number found in untreated cells. 30S subunit formation was not affected. Ninety minutes was required for resynthesis to give the control level of 50S particles. Protein synthesis rates were diminished for up to 4 h after the removal of the macrolides. This continuing inhibition of translation was the result of prolonged binding of the antibiotics to the 50S subunit as measured by 14C-erythromycin binding to ribosomes in treated cells. The limiting factors in recovery from macrolide inhibition in these cells, reflected as a PAE, are the time required for the synthesis of new 50S subunits and the slow loss of the antibiotics from ribosomes in inhibited cells.
Figures
Similar articles
-
Macrolide antibiotic inhibition of translation and 50S ribosomal subunit assembly in methicillin-resistant Staphylococcus aureus cells.Microb Drug Resist. 1998 Fall;4(3):169-74. doi: 10.1089/mdr.1998.4.169. Microb Drug Resist. 1998. PMID: 9818968
-
Azithromycin and clarithromycin inhibition of 50S ribosomal subunit formation in Staphylococcus aureus cells.Curr Microbiol. 1998 Feb;36(2):119-23. doi: 10.1007/s002849900290. Curr Microbiol. 1998. PMID: 9425251
-
50S ribosomal subunit synthesis and translation are equivalent targets for erythromycin inhibition in Staphylococcus aureus.Antimicrob Agents Chemother. 1996 May;40(5):1301-3. doi: 10.1128/AAC.40.5.1301. Antimicrob Agents Chemother. 1996. PMID: 8723490 Free PMC article.
-
Bacterial ribosomal subunit synthesis: a novel antibiotic target.Curr Drug Targets Infect Disord. 2001 May;1(1):19-36. doi: 10.2174/1568005013343281. Curr Drug Targets Infect Disord. 2001. PMID: 12455231 Review.
-
Rokitamycin: bacterial resistance to a 16-membered ring macrolide differs from that to 14- and 15-membered ring macrolides.J Chemother. 2002 Apr;14(2):115-31. doi: 10.1179/joc.2002.14.2.115. J Chemother. 2002. PMID: 12017366 Review.
Cited by
-
Impact of Target Turnover on the Translation of Drug-Target Residence Time to Time-Dependent Antibacterial Activity.ACS Infect Dis. 2021 Sep 10;7(9):2755-2763. doi: 10.1021/acsinfecdis.1c00317. Epub 2021 Aug 6. ACS Infect Dis. 2021. PMID: 34357770 Free PMC article.
-
Deletion of the multiple-drug efflux pump AcrAB in Escherichia coli prolongs the postantibiotic effect.Antimicrob Agents Chemother. 2005 Mar;49(3):1206-8. doi: 10.1128/AAC.49.3.1206-1208.2005. Antimicrob Agents Chemother. 2005. PMID: 15728929 Free PMC article.
-
Antibiotics targeting bacterial ribosomal subunit biogenesis.J Antimicrob Chemother. 2020 Apr 1;75(4):787-806. doi: 10.1093/jac/dkz544. J Antimicrob Chemother. 2020. PMID: 31942624 Free PMC article. Review.
-
Development of an extrachromosomal cloning vector system for use in Borrelia burgdorferi.Proc Natl Acad Sci U S A. 2000 Apr 25;97(9):4850-5. doi: 10.1073/pnas.080068797. Proc Natl Acad Sci U S A. 2000. PMID: 10781091 Free PMC article.
-
Time course of microbiologic outcome and gene expression in Candida albicans during and following in vitro and in vivo exposure to fluconazole.Antimicrob Agents Chemother. 2006 Apr;50(4):1311-9. doi: 10.1128/AAC.50.4.1311-1319.2006. Antimicrob Agents Chemother. 2006. PMID: 16569846 Free PMC article.
References
Publication types
MeSH terms
Substances
LinkOut - more resources
Full Text Sources
Medical
