. 1999 May 31;145(5):993-1007.
doi: 10.1083/jcb.145.5.993.

Yeast Bim1p promotes the G1-specific dynamics of microtubules

Affiliations

Yeast Bim1p promotes the G1-specific dynamics of microtubules

J S Tirnauer et al. J Cell Biol. .

Abstract

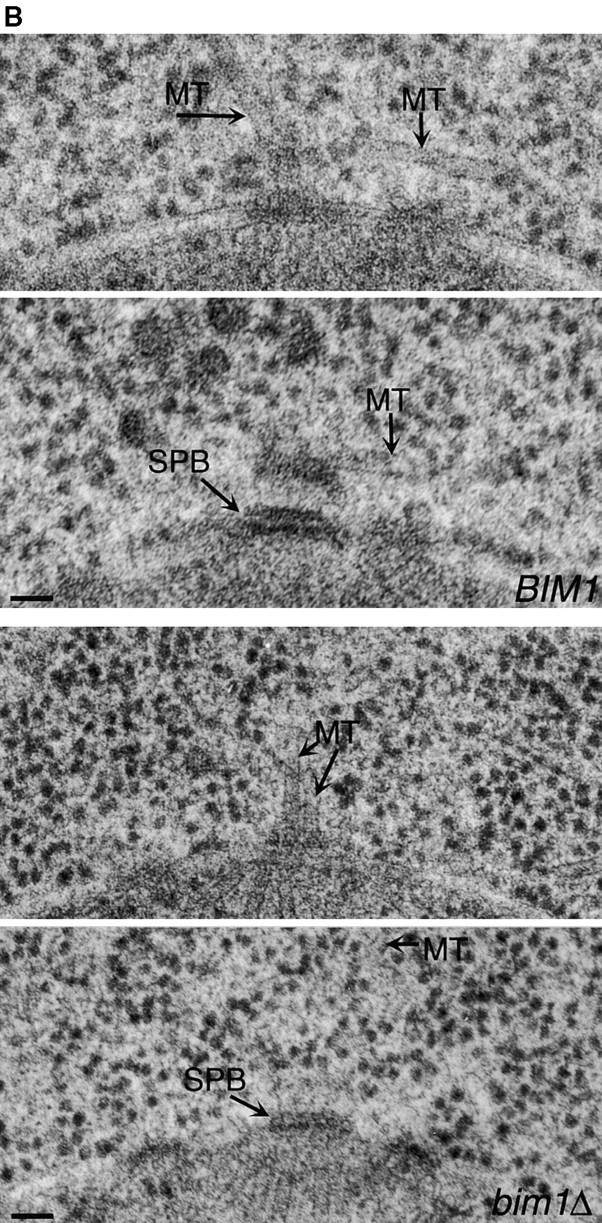
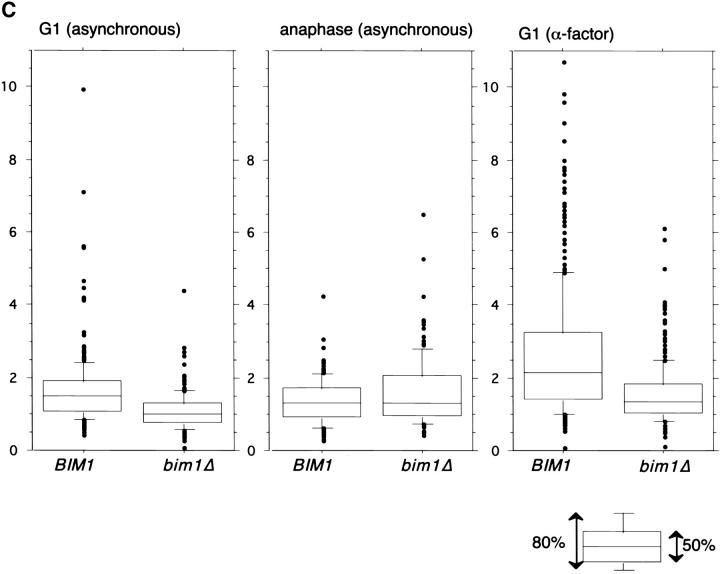
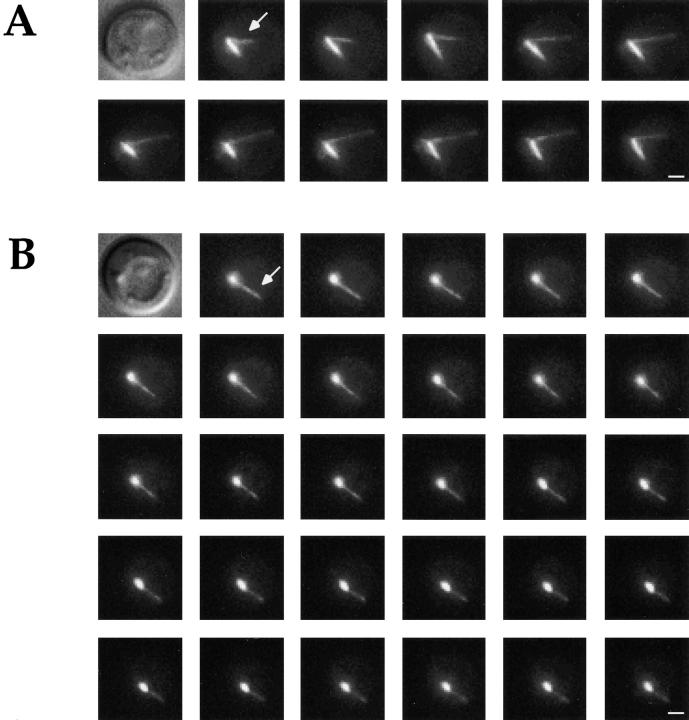
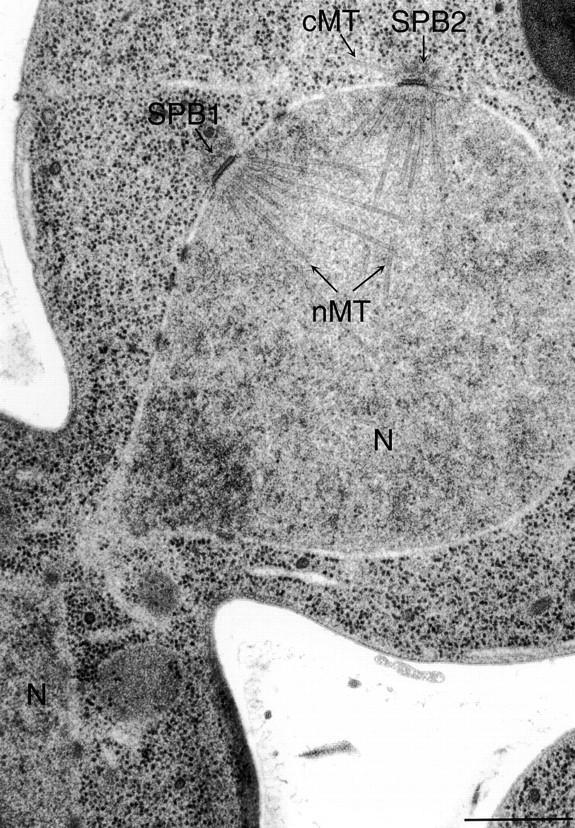
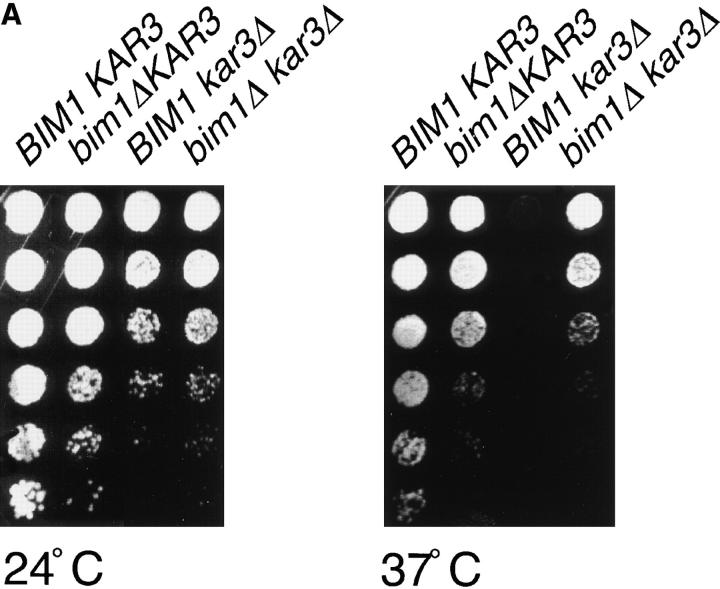
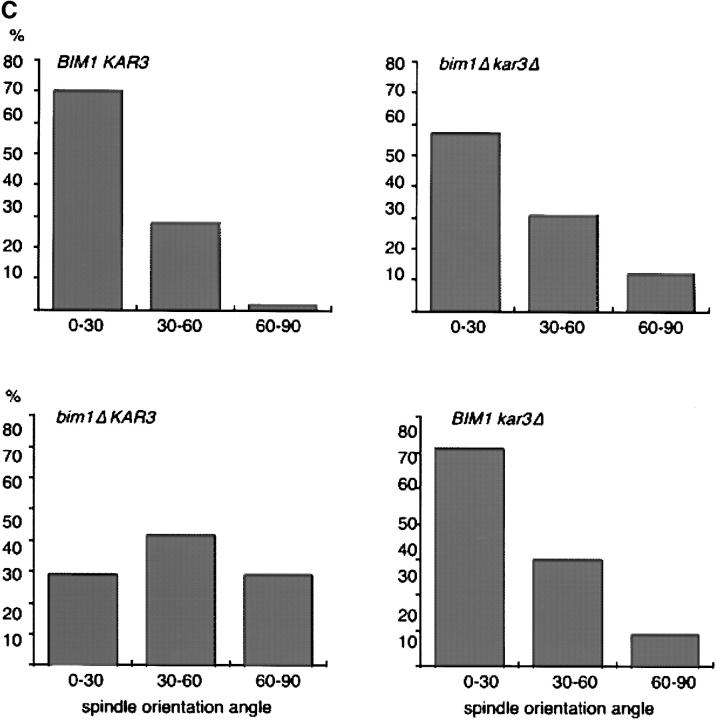
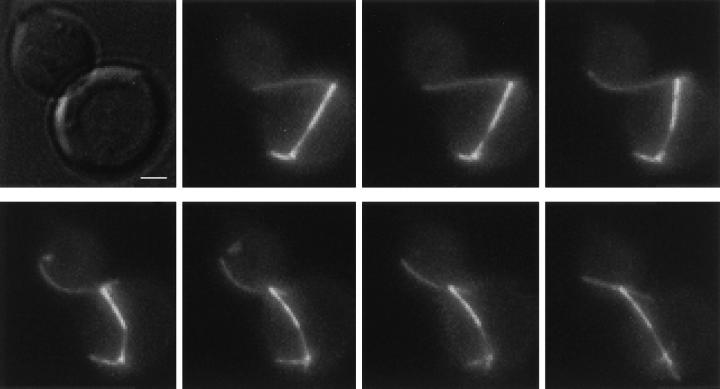
Microtubule dynamics vary during the cell cycle, and microtubules appear to be more dynamic in vivo than in vitro. Proteins that promote dynamic instability are therefore central to microtubule behavior in living cells. Here, we report that a yeast protein of the highly conserved EB1 family, Bim1p, promotes cytoplasmic microtubule dynamics specifically during G1. During G1, microtubules in cells lacking BIM1 showed reduced dynamicity due to a slower shrinkage rate, fewer rescues and catastrophes, and more time spent in an attenuated/paused state. Human EB1 was identified as an interacting partner for the adenomatous polyposis coli (APC) tumor suppressor protein. Like human EB1, Bim1p localizes to dots at the distal ends of cytoplasmic microtubules. This localization, together with data from electron microscopy and a synthetic interaction with the gene encoding the kinesin Kar3p, suggests that Bim1p acts at the microtubule plus end. Our in vivo data provide evidence of a cell cycle-specific microtubule-binding protein that promotes microtubule dynamicity.


Figures

Figure 1
Figure 1
Localization of GFP-Bim1p. Images of asynchronously grown bim1Δ cells expressing GFP-Bim1p from the BIM1 promoter are shown. These images are two-dimensional composites of Z-focal plane series 0.5 μm apart. Arrows indicate microtubule distal ends. Bar, 1 μm.
Figure 2
Figure 2
Cells lacking BIM1 have shorter cytoplasmic microtubules during G1. (A) Fluorescence images of GFP-Tub1p in BIM1 and bim1Δ cells. Bar, 1 μm. (B) Serial section electron micrographs through the spindle pole bodies of BIM1 and bim1Δ cells. (Top) BIM1 cell. Two cytoplasmic microtubules (MT) can be seen at the outer plaque of the spindle pole body (SPB). Complete serial sections through the SPB of this cell revealed three cytoplasmic microtubules. Bar, 50 nm. (Bottom) bim1Δ cell. Three cytoplasmic microtubules can be detected. Complete serial sections through the SPB of this cell revealed four cytoplasmic microtubules. Bar, 50 nm. (C) Cytoplasmic microtubule lengths in BIM1 and bim1Δ cells expressing GFP-Tub1p. 150–300 cells were measured for each condition. The box plot shows the median length (line in the center of the box); the box contains 50% of the data points surrounding the median, the outer bars contain 80% of the data points surrounding the median, and the dots are the outlying 20% of data points (see inset).
Figure 2
Figure 2
Cells lacking BIM1 have shorter cytoplasmic microtubules during G1. (A) Fluorescence images of GFP-Tub1p in BIM1 and bim1Δ cells. Bar, 1 μm. (B) Serial section electron micrographs through the spindle pole bodies of BIM1 and bim1Δ cells. (Top) BIM1 cell. Two cytoplasmic microtubules (MT) can be seen at the outer plaque of the spindle pole body (SPB). Complete serial sections through the SPB of this cell revealed three cytoplasmic microtubules. Bar, 50 nm. (Bottom) bim1Δ cell. Three cytoplasmic microtubules can be detected. Complete serial sections through the SPB of this cell revealed four cytoplasmic microtubules. Bar, 50 nm. (C) Cytoplasmic microtubule lengths in BIM1 and bim1Δ cells expressing GFP-Tub1p. 150–300 cells were measured for each condition. The box plot shows the median length (line in the center of the box); the box contains 50% of the data points surrounding the median, the outer bars contain 80% of the data points surrounding the median, and the dots are the outlying 20% of data points (see inset).
Figure 5
Figure 5
Steady-state tubulin levels are unaffected by deletion of BIM1. BIM1 and bim1Δ cells were grown asynchronously (lanes 1, 2, 5, and 6) or arrested with α-factor (lanes 3 and 4) and Western blotting was performed on cell lysates. (Top) Anti– α-tubulin blot. Cells simultaneously expressing endogenous α-tubulin and GFP-Tub1p, used for the microtubule dynamics measurements (lanes 5 and 6), show an additional band at ∼80 kD, which represents the fusion protein. (Bottom) Anti–β-tubulin blot.
Figure 3
Figure 3
Cytoplasmic microtubule dynamics in living cells expressing GFP-Tub1p. The sequences shown are two-dimensional projections of Z-focal plane series 0.3 μm apart; the interval between images is 8 s. (A) Unbudded (G1) BIM1 cell. The arrow points to a cytoplasmic microtubule that grows 1.8 μm in 48 s and then begins to shrink. (B) Unbudded (G1) bim1Δ cell. The arrow points to a cytoplasmic microtubule that undergoes a continuous pause for 232 s (it appears to shrink somewhat in the last 12 frames because it rotates out of the focal plane). Bars, 1 μm.
Figure 4
Figure 4
BIM1 deletion reduces cytoplasmic microtubule dynamics in G1. BIM1 and bim1Δ cells expressing GFP-Tub1p were imaged by time-lapse microscopy at 8-s intervals. Life history plots were constructed from measurements of three-dimensional microtubule length (see Materials and Methods) versus time. The scale is the same for each plot. (A) Cytoplasmic microtubule dynamics in G1 cells. (B) Cytoplasmic microtubule dynamics in mitotic (preanaphase or anaphase) cells.
Figure 4
Figure 4
BIM1 deletion reduces cytoplasmic microtubule dynamics in G1. BIM1 and bim1Δ cells expressing GFP-Tub1p were imaged by time-lapse microscopy at 8-s intervals. Life history plots were constructed from measurements of three-dimensional microtubule length (see Materials and Methods) versus time. The scale is the same for each plot. (A) Cytoplasmic microtubule dynamics in G1 cells. (B) Cytoplasmic microtubule dynamics in mitotic (preanaphase or anaphase) cells.
Figure 6
Figure 6
Aberrant spindle structures in the bim1Δ mutant. Two spindle pole bodies (SPB1 and SPB2) are seen in the mother cell, yet the nucleus (N) can be seen in the bud. Nuclear microtubule arrays (nMT) emanate from the SPBs but do not form a bipolar spindle. Complete serial sections through the SPBs show numerous cytoplasmic microtubules (cMT) at the SPB. Bar, 0.5 μm.
Figure 7
Figure 7
BIM1 is transcriptionally regulated. GFP-BIM1 cells were arrested in G1 and samples were taken at 10-min intervals after release. Cell cycle position was confirmed by cell morphology. (A) Northern blotting was performed using a probe to the BIM1 coding region (top). Northern blotting of the same samples for the ACT1 mRNA is shown for comparison (bottom). After normalization to actin levels, the difference from the G1/S peak to the trough during mitosis was fourfold. (B) Western blotting was performed using a polyclonal antibody to the GFP epitope. Western blotting for actin is shown below for comparison. After normalization to actin levels, the difference from the G1/S peak to the trough during mitosis was 1.9.
Figure 8
Figure 8
Nuclear position defect of bim1Δ cells. BIM1 and bim1Δ cells expressing the spindle pole marker Nuf2p-GFP were grown asynchronously, and preanaphase cells were photographed for spindle measurements. The spindle angle was calculated as the angle between a line drawn through the mother-bud axis and a second line drawn between the two spindle poles. 200 cells combined from two independent experiments were measured. (Left) Distribution of spindle angles; (right) spindle angle plotted against distance to the bud neck, measured from the proximal spindle pole body. (A) BIM1; mean angle 32°; mean distance to the bud neck 1.0 ± 0.4 μm. (B) bim1Δ; mean angle 43°; mean distance to the bud neck 2.1 ± 1.2 μm.
Figure 10
Figure 10
Functional opposition between bim1Δ and kar3Δ. (A) bim1Δ suppresses the temperature-sensitive growth defect of kar3Δ cells. Serial fivefold dilutions of the indicated strains were grown at 24°C and 37°C for 2 d. (B) bim1Δ kar3Δ cells have cytoplasmic microtubules of intermediate length during G1. Indirect antitubulin immunofluorescence was performed on strains arrested with α-factor. (C) kar3Δ suppresses the spindle orientation defect of bim1Δ cells. Spindle orientation angle relative to the mother-bud axis was calculated in 200 cells from each strain, using indirect antitubulin immunofluorescence.
Figure 10
Figure 10
Functional opposition between bim1Δ and kar3Δ. (A) bim1Δ suppresses the temperature-sensitive growth defect of kar3Δ cells. Serial fivefold dilutions of the indicated strains were grown at 24°C and 37°C for 2 d. (B) bim1Δ kar3Δ cells have cytoplasmic microtubules of intermediate length during G1. Indirect antitubulin immunofluorescence was performed on strains arrested with α-factor. (C) kar3Δ suppresses the spindle orientation defect of bim1Δ cells. Spindle orientation angle relative to the mother-bud axis was calculated in 200 cells from each strain, using indirect antitubulin immunofluorescence.
Figure 9
Figure 9
Correction of the spindle position defect in a bim1Δ cell. bim1Δ cells expressing GFP-Tub1p were photographed by time-lapse microscopy. The images are shown from a representative cell with a misoriented anaphase spindle that was rapidly repositioned. Each image is a two-dimensional composite of a Z-focal plane series of 0.3-μm sections; the interval between images is 16 s. Bar, 1 μm.

Similar articles

Cited by

References

    1. Beinhauer JD, Hagan IM, Hegemann JH, Fleig U. Mal3, the fission yeast homolog of the human APC-interacting protein EB-1, is required for microtubule integrity and the maintenance of cell form. J Cell Biol. 1997;139:717–728. - PMC - PubMed
    1. Belmont LD, Mitchison TJ. Identification of a protein that interacts with tubulin dimers and increases the catastrophe rate of microtubules. Cell. 1996;84:623–631. - PubMed
    1. Berlin V, Styles CA, Fink GR. BIK1, a protein required for microtubule function during mating and mitosis in Saccharomyces cerevisiae, colocalizes with tubulin. J Cell Biol. 1990;111:2573–2586. - PMC - PubMed
    1. Berrueta L, Kraeft S-K, Tirnauer JS, Schuyler S, Chen LB, Hill DE, Pellman D, Bierer B. The adenomatous polyposis coli-binding protein EB1 is associated with cytoplasmic and spindle microtubules. Proc Natl Acad Sci USA. 1998;95:10596–10601. - PMC - PubMed
    1. Carminati JL, Stearns T. Microtubules orient the mitotic spindle in yeast through dynein-dependent interactions with the cell cortex. J Cell Biol. 1997;138:629–641. - PMC - PubMed

Publication types

MeSH terms