

Explaining differences in English hospital death rates using routinely collected data
- PMID: 10356004
- PMCID: PMC27892
- DOI: 10.1136/bmj.318.7197.1515
Explaining differences in English hospital death rates using routinely collected data
Abstract
Objectives: To ascertain hospital inpatient mortality in England and to determine which factors best explain variation in standardised hospital death ratios.
Design: Weighted linear regression analysis of routinely collected data over four years, with hospital standardised mortality ratios as the dependent variable.
Setting: England.
Subjects: Eight million discharges from NHS hospitals when the primary diagnosis was one of the diagnoses accounting for 80% of inpatient deaths.
Main outcome measures: Hospital standardised mortality ratios and predictors of variations in these ratios.
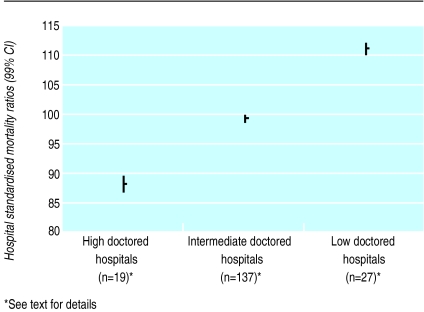
Results: The four year crude death rates varied across hospitals from 3.4% to 13.6% (average for England 8.5%), and standardised hospital mortality ratios ranged from 53 to 137 (average for England 100). The percentage of cases that were emergency admissions (60% of total hospital admissions) was the best predictor of this variation in mortality, with the ratio of hospital doctors to beds and general practitioners to head of population the next best predictors. When analyses were restricted to emergency admissions (which covered 93% of all patient deaths analysed) number of doctors per bed was the best predictor.
Conclusion: Analysis of hospital episode statistics reveals wide variation in standardised hospital mortality ratios in England. The percentage of total admissions classified as emergencies is the most powerful predictor of variation in mortality. The ratios of doctors to head of population served, both in hospital and in general practice, seem to be critical determinants of standardised hospital death rates; the higher these ratios, the lower the death rates in both cases.
Figures
Comment in
-
Differences in death rates in English hospitals. Effects of admission rates may have been understated.BMJ. 1999 Sep 25;319(7213):854. BMJ. 1999. PMID: 10496848 Free PMC article. No abstract available.
-
Differences in death rates in English hospitals. Data are inadequate basis for drawing conclusion of paper.BMJ. 1999 Sep 25;319(7213):854-5. BMJ. 1999. PMID: 10576832 No abstract available.
-
Principal variable is not what it seems in league tables.BMJ. 2001 May 12;322(7295):1181. BMJ. 2001. PMID: 11379583 Free PMC article. No abstract available.
References
-
- Nightingale F. Notes on hospitals. 3rd ed. London: Longman Green; 1863.
-
- Buckle F. Vital and economical statistics of the hospitals, infirmaries, etc of England and Wales for the year 1863. London: Churchill; 1865.
-
- National Confidential Enquiry into Perioperative Deaths (NCEPOD) Report 1992. London: NCEPOD; 1992.
-
- Jarman B, Lang H, Ruggles R, Wallace M, Gault S, Astin P. The contribution of London’s academic medicine to healthcare and the economy – report commissioned by the deans of the medical schools of the University of London. London: University of London; 1997.
-
- Commission on Professional Hospital Activities. Risk adjusted hospital mortality norms 1986 workbook. Ann Arbor, MI: CPHA; 1987.
MeSH terms
LinkOut - more resources
Full Text Sources