

Influence of data display formats on physician investigators' decisions to stop clinical trials: prospective trial with repeated measures
- PMID: 10356010
- PMCID: PMC27896
- DOI: 10.1136/bmj.318.7197.1527
Influence of data display formats on physician investigators' decisions to stop clinical trials: prospective trial with repeated measures
Abstract
Objective: To examine the effect of the method of data display on physician investigators' decisions to stop hypothetical clinical trials for an unplanned statistical analysis.
Design: Prospective, mixed model design with variables between subjects and within subjects (repeated measures).
Setting: Comprehensive cancer centre.
Participants: 34 physicians, stratified by academic rank, who were conducting clinical trials.
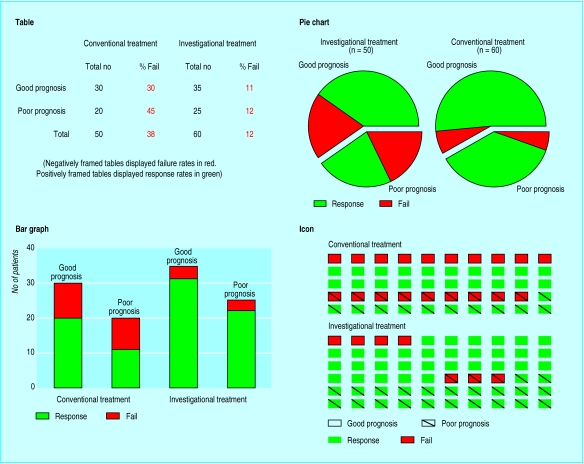
Interventions: PARTICIPANTS were shown tables, pie charts, bar graphs, and icon displays containing hypothetical data from a clinical trial and were asked to decide whether to continue the trial or stop for an unplanned statistical analysis.
Main outcome measure: Percentage of accurate decisions with each type of display.
Results: Accuracy of decisions was affected by the type of data display and positive or negative framing of the data. More correct decisions were made with icon displays than with tables, pie charts, and bar graphs (82% v 68%, 56%, and 43%, respectively; P=0.03) and when data were negatively framed rather than positively framed in tables (93% v 47%; P=0.004).
Conclusions: Clinical investigators' decisions can be affected by factors unrelated to the actual data. In the design of clinical trials information systems, careful consideration should be given to the method by which data are framed and displayed in order to reduce the impact of these extraneous factors.
Figures
Comment in
-
Same information, different decisions: format counts. Format as well as content matters in clinical information.BMJ. 1999 Jun 5;318(7197):1501-2. doi: 10.1136/bmj.318.7197.1501. BMJ. 1999. PMID: 10355983 Free PMC article. No abstract available.
-
Influence of data display formats on decisions to stop clinical trials. Paper is misleading, like a sheep dressed in a wolf's clothing.BMJ. 1999 Oct 16;319(7216):1070. doi: 10.1136/bmj.319.7216.1070. BMJ. 1999. PMID: 10521214 Free PMC article. No abstract available.
References
-
- Friedman LM, Furberg CD, DeMets DL. Fundamentals of clinical trials. 2nd ed. Littleton, MA: PSG Publishing; 1985.
-
- Cleveland WS, McGill R. Graphical perception: the visual decoding of quantitative material when on graphical displays of data. J R Stat Soc Ser A. 1987;150:192–229.
-
- Cochran WG. The comparison of percentages in matched samples. Biometrika. 1950;37:256–266. - PubMed
-
- McNemar Q. Note on the sampling error of the differences between correlated proportions or percentages. Psychometrika. 1947;12:153–157. - PubMed
-
- Elting LS, Bodey GP. Is a picture worth a thousand medical words? A randomized trial of reporting formats for medical research data. Methods Inf Med. 1991;30:145–150. - PubMed
Publication types
MeSH terms
LinkOut - more resources
Full Text Sources
Medical