

Calcium currents during contraction and shortening in enzymatically isolated murine skeletal muscle fibres
- PMID: 10358116
- PMCID: PMC2269387
- DOI: 10.1111/j.1469-7793.1999.0757s.x
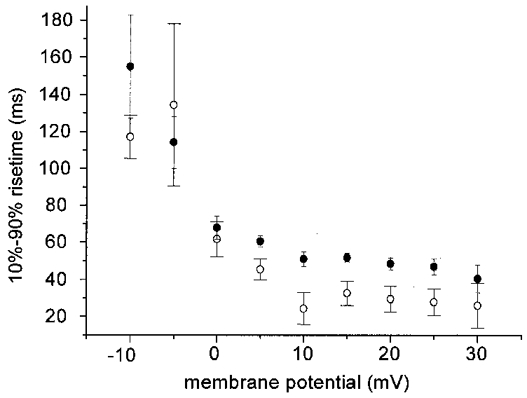
Calcium currents during contraction and shortening in enzymatically isolated murine skeletal muscle fibres
Abstract
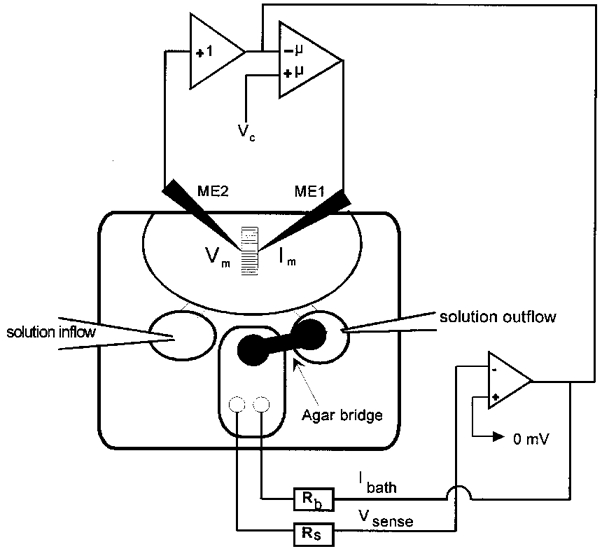
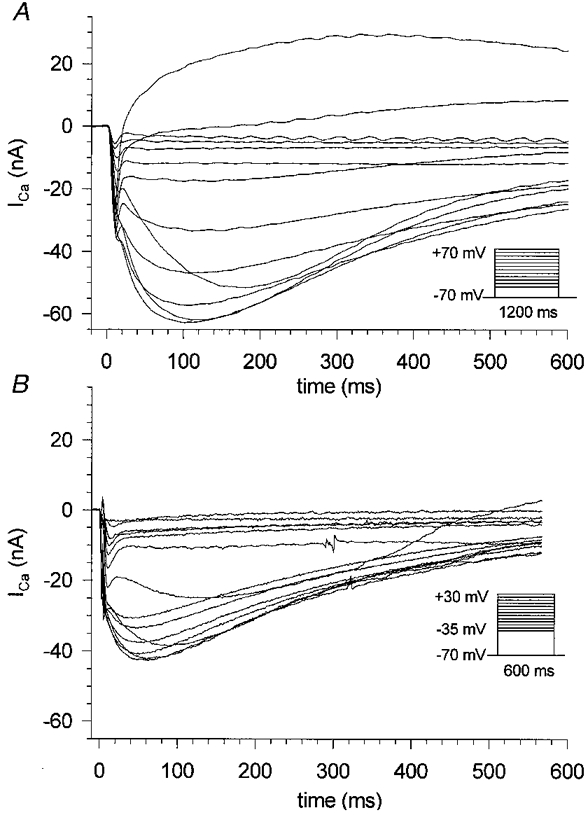
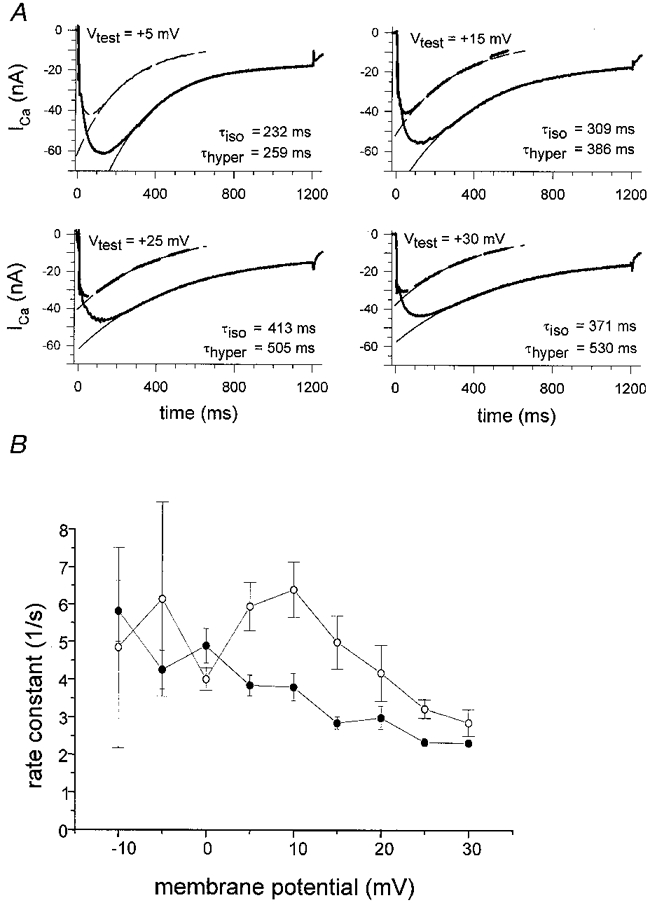
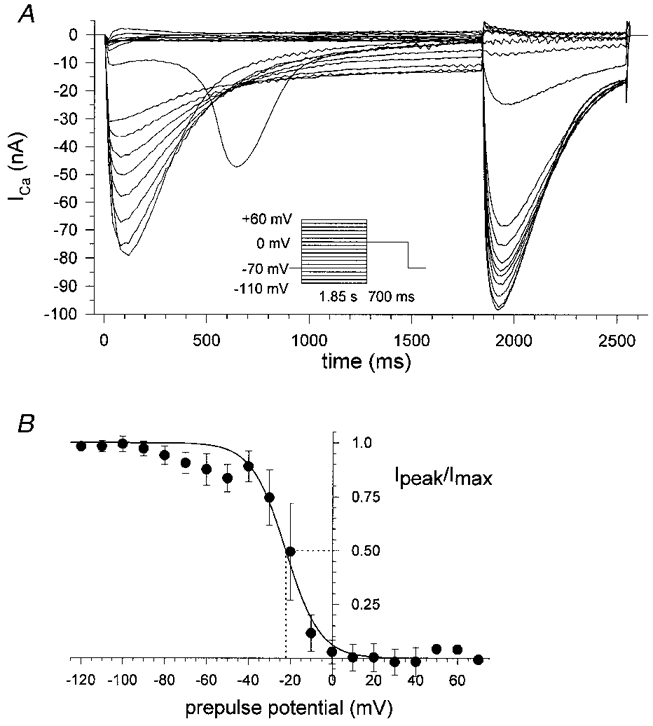
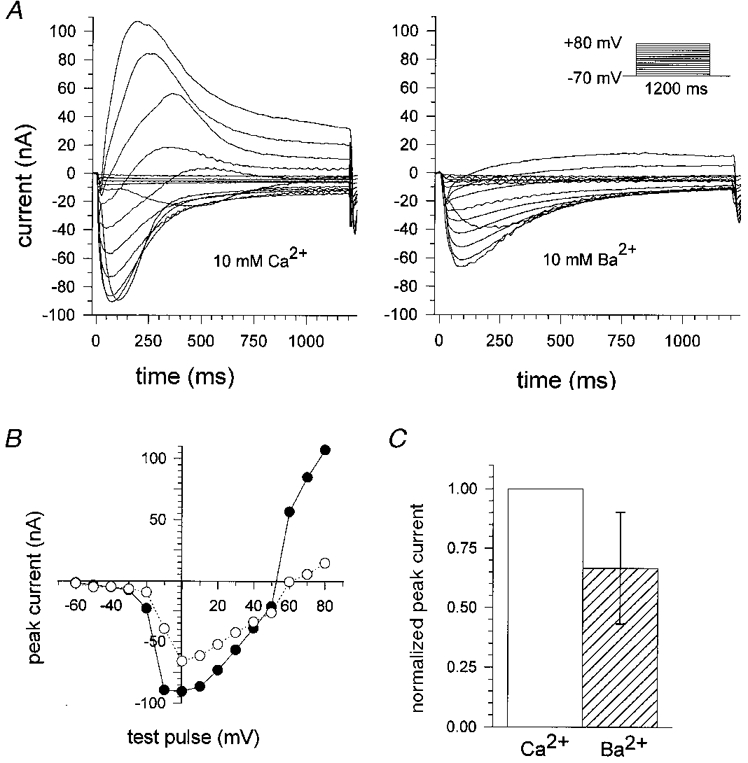
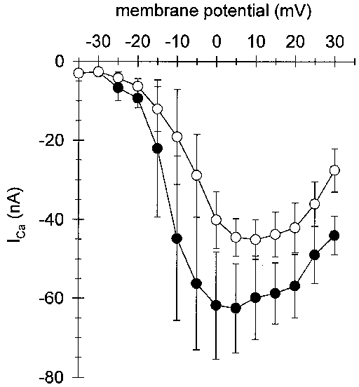
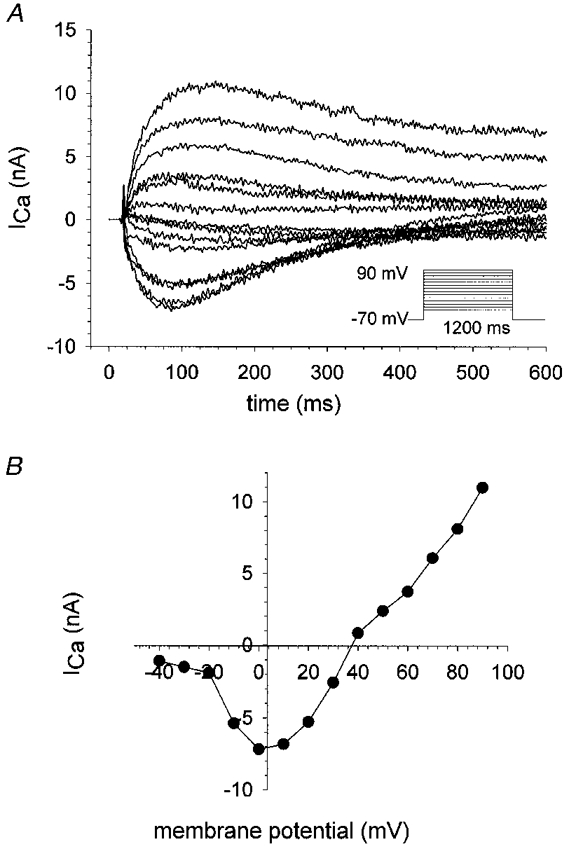
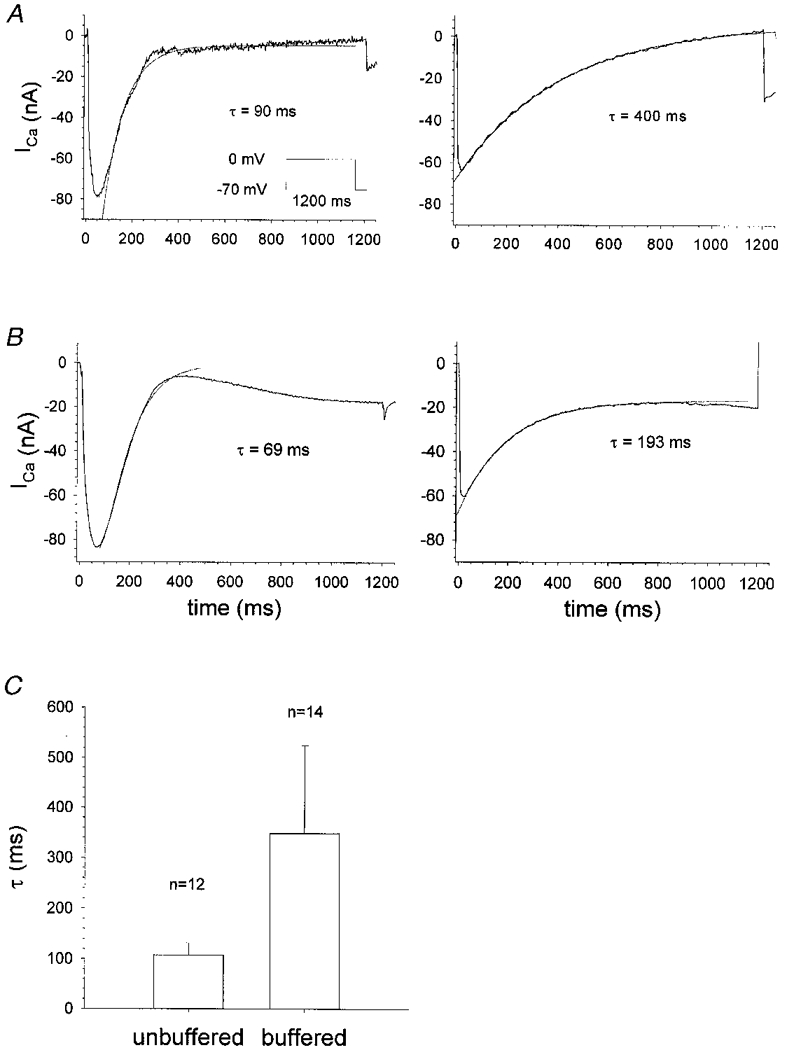
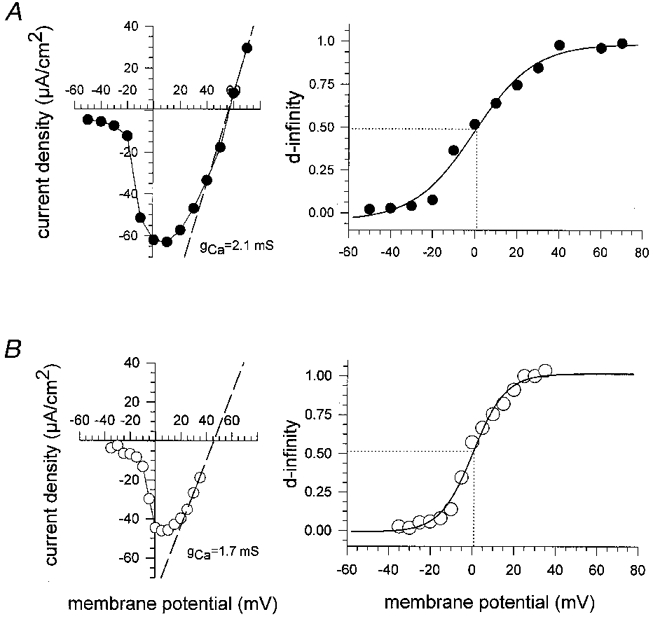
1. Calcium currents (ICa) were monitored in enzymatically isolated murine toe muscle fibres using the two-microelectrode voltage-clamp technique. ICa was recorded (i) in hypertonic solution to suppress contraction, and (ii) in actively shortening fibres in isotonic solution. 2. In hypertonic solution the threshold potential for ICa was about -30 mV for both 2 and 10 mM external Ca2+ solution. Maximum peak currents measured -12.6 +/- 2.3 nA (mean +/- s.d.; n = 4) in 2 mM Ca2+ and -65 +/- 15 nA (n = 7) in 10 mM Ca2+. The time to peak (TTP) ICa was 96 +/- 22 ms (n = 4) in 2 mM Ca2+ and 132 +/- 13 ms (n = 7) in 10 mM Ca2+. The exponential decay of ICa was similar in 2 and 10 mM Ca2+ with rate constants (tau-1(V)) of 3.7 s-1 (2 mM) and 3.8 s-1 (10 mM) at +10 mV. 3. ICa in isotonic 10 mM Ca2+ solution was recorded by inserting the micropipettes exactly opposite to each other close to the centre of mass of the fibre where negligible contraction-induced movement occurs. 4. In isotonic 10 mM Ca2+ solution ICa had a smaller peak amplitude (-45 +/- 5 nA; n = 7) and faster TTP (82.8 +/- 22.1 ms; n = 7) than in hypertonic solution. The exponential decay of ICa showed a significantly larger tau-1(V) of 6.4 s-1 at +10 mV (P < 0.03). 5. To test for calcium depletion, extracellular Ca2+ was buffered by malic acid in isotonic solution to 9 mM. The decay of ICa had a time constant of 348 +/- 175 ms (n = 14) vs. 107 +/- 24 ms (n = 12; P < 0.001) at 0 mV in unbuffered 10 mM Ca2+ solution. 6. We conclude that calcium depletion from the transverse tubular system contributes significantly to the decay of calcium currents in murine toe muscle fibres under hypertonic as well as isotonic conditions. In the latter, depletion is even more prominent.
Figures
References
Publication types
MeSH terms
Substances
LinkOut - more resources
Full Text Sources
Miscellaneous