

The effects of exercise and diet manipulation on the capacity to perform prolonged exercise in the heat and in the cold in trained humans
- PMID: 10358130
- PMCID: PMC2269386
- DOI: 10.1111/j.1469-7793.1999.0919s.x
The effects of exercise and diet manipulation on the capacity to perform prolonged exercise in the heat and in the cold in trained humans
Abstract
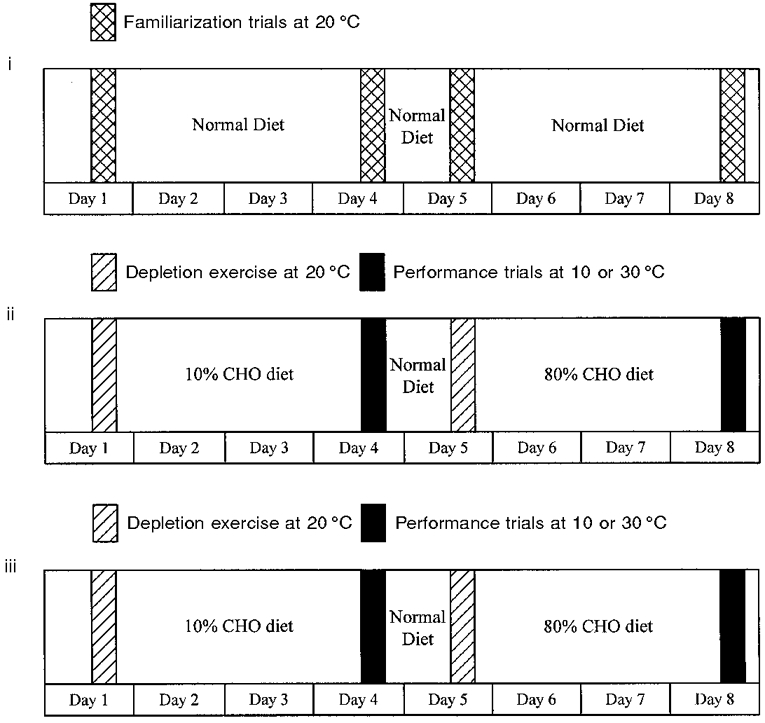
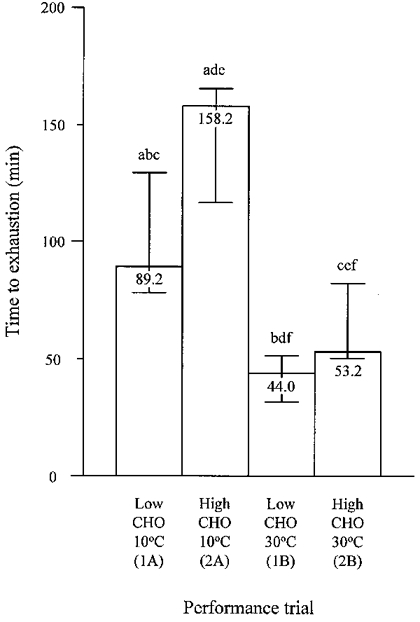
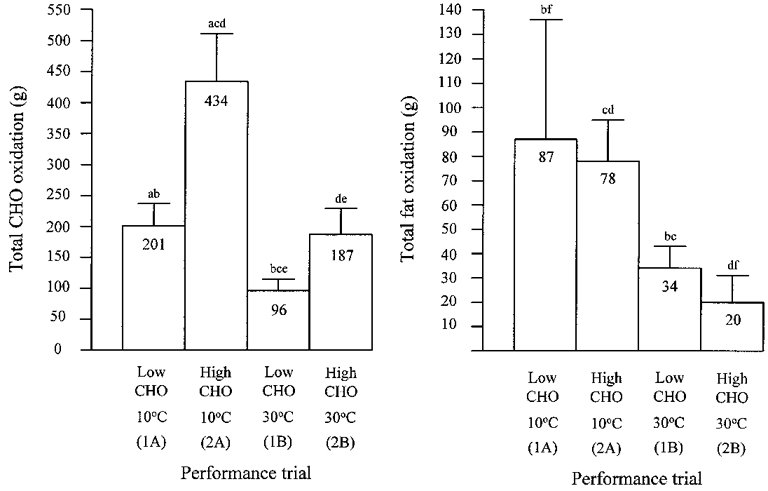
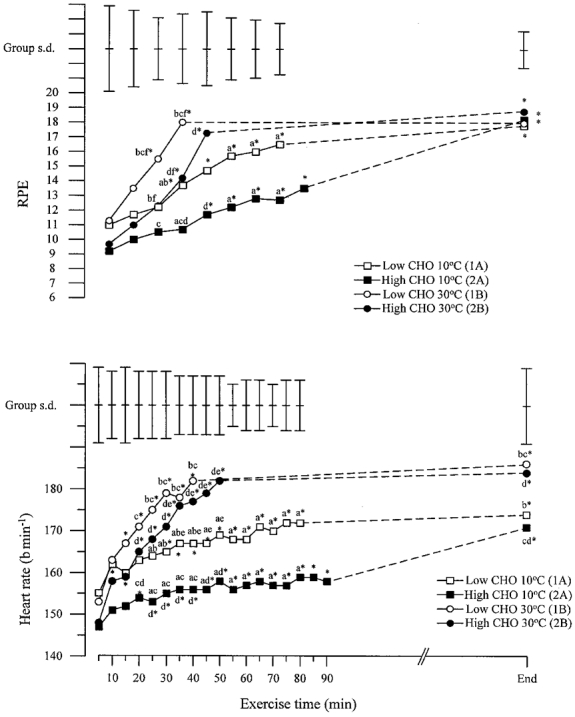
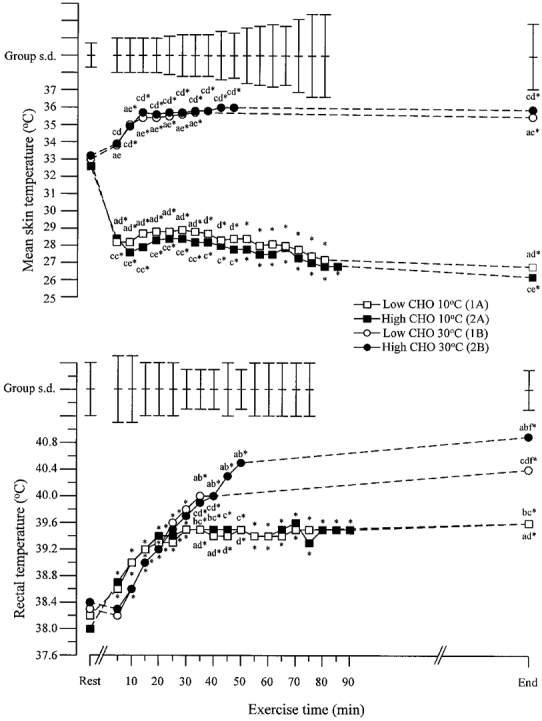
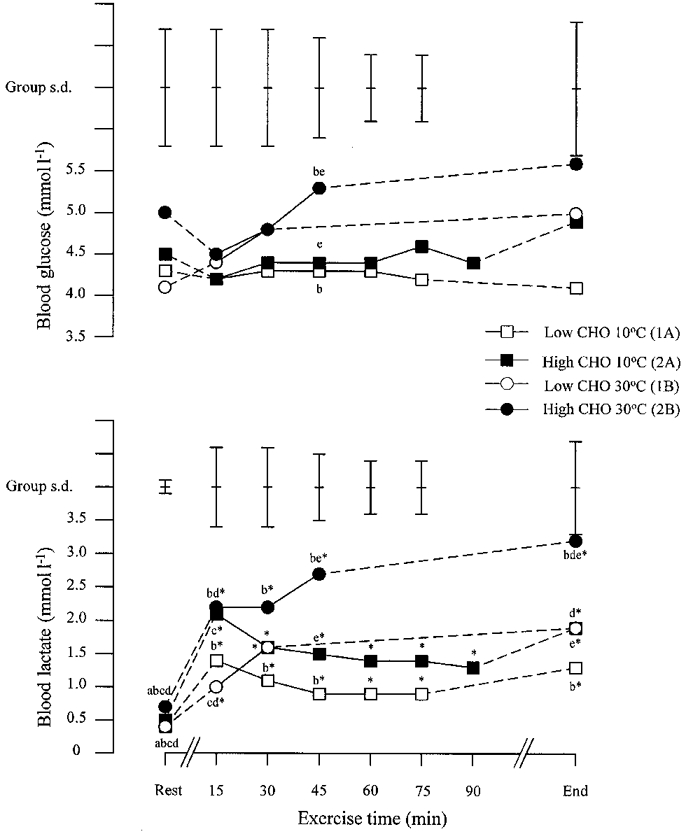
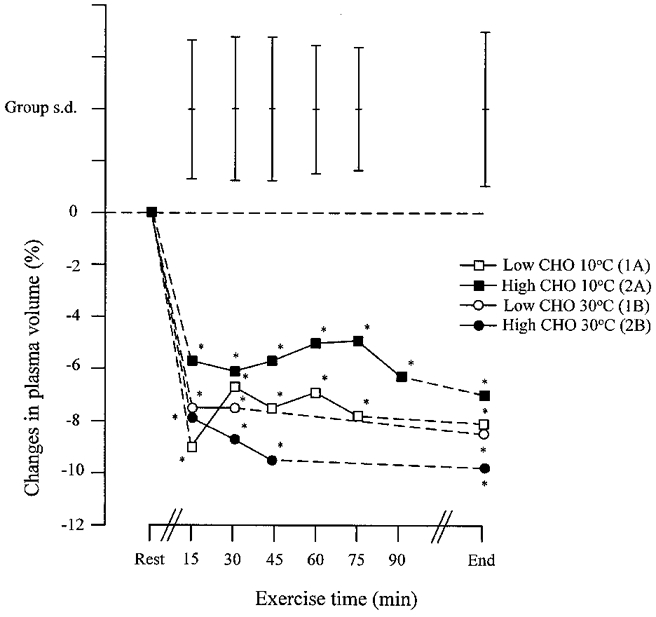
1. This study examined the effects of exercise and diet manipulation intended to alter initial muscle glycogen levels on the capacity to perform prolonged exercise at two ambient temperatures. 2. Six well-trained cyclists participated in randomized order in two diet and exercise regimens each lasting 8 days and comprising four cycle tests to exhaustion at 70 % of maximum oxygen uptake. On days 1 and 5, subjects exercised to exhaustion to deplete muscle glycogen. Three days after each depletion trial a diet providing 10 % (low carbohydrate (CHO)) or 80 % (high CHO) of energy as CHO was consumed, and each diet was followed by a performance trial at the same ambient temperature, either 10 or 30 C (days 4 and 8). This schedule was repeated after a week, but performance trials were carried out at the other ambient temperature. 3. In the cold, cycling time increased (median (range)) from 89.2 min (78.0-129.5 min) on the low CHO trial to 158.2 min (116.9-165.6 min) on the high CHO trial (P < 0.01). In the heat, cycling time increased from 44.0 min (31.8-51.4 min) on the low CHO trial to 53.2 min (50.2-82.2 min) on the high CHO trial (P = 0.02). Total CHO oxidized during exercise in the cold after the low CHO diet was higher than in the heat after either diet suggesting that exercise in the heat was terminated before all available CHO stores had been emptied.
Figures
References
-
- Bergstrom J, Hermansen L, Hultman E, Saltin B. Diet, muscle glycogen and physical performance. Acta Physiologica Scandinavica. 1967;71:140–150. - PubMed
-
- Bergstrom J, Hultman E. Muscle glycogen synthesis after exercise: an enhancing factor localised to the muscle cells in man. Nature. 1966;210:309–310. - PubMed
-
- Bergstrom J, Hultman E. A study of the glycogen metabolism during exercise in man. Scandinavian Journal of Clinical and Laboratory Investigation. 1967;19:218–228. - PubMed
-
- Borg GA. Psychophysical bases of perceived exertion. Medicine and Science in Sports and Exercise. 1982;14:377–381. - PubMed
-
- Bruck K, Olschewski H. Body temperature related factors diminishing the drive to exercise. Canadian The Journal of Physiology and Pharmacology. 1987;65:1274–1280. - PubMed
Publication types
MeSH terms
Substances
LinkOut - more resources
Full Text Sources
Other Literature Sources
Medical