. 1999 Jun;103(11):1527-37.
doi: 10.1172/JCI5766.

Mild spherocytosis and altered red cell ion transport in protein 4. 2-null mice

Affiliations

Mild spherocytosis and altered red cell ion transport in protein 4. 2-null mice

L L Peters et al. J Clin Invest. 1999 Jun.

Abstract

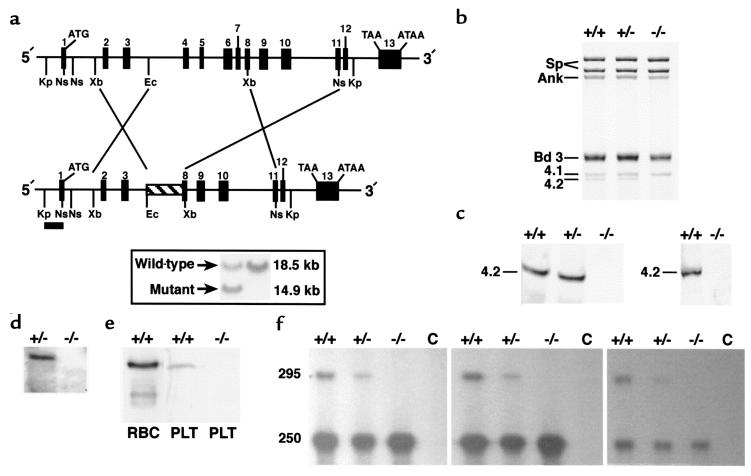
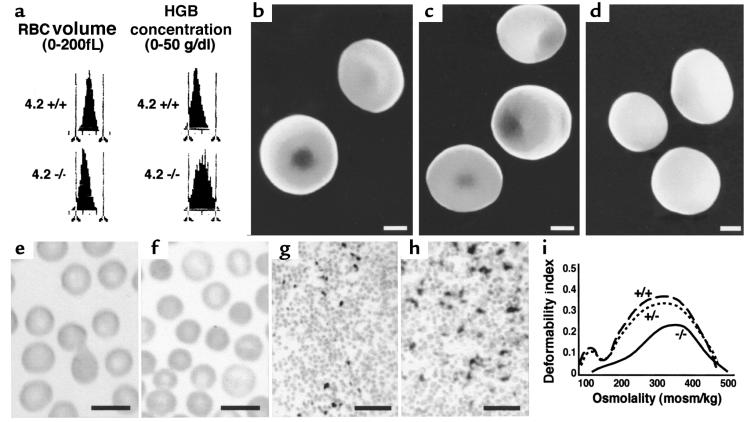
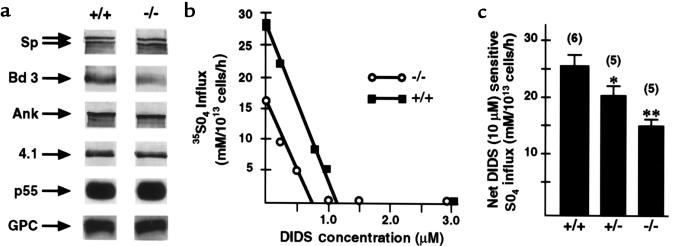
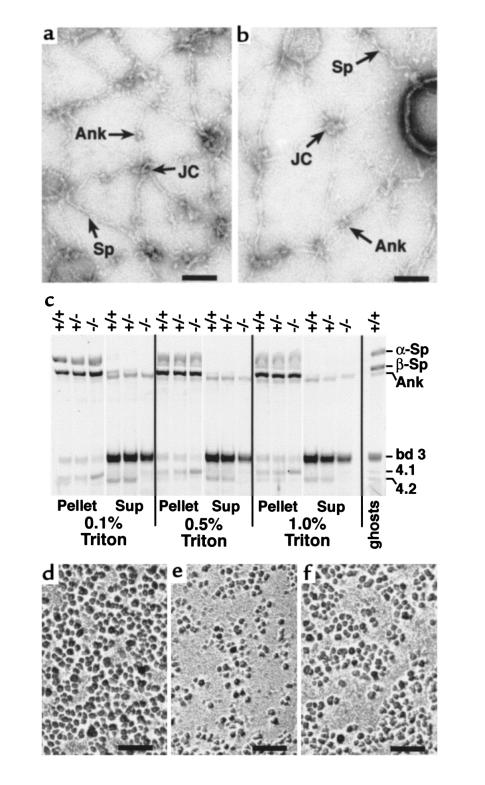
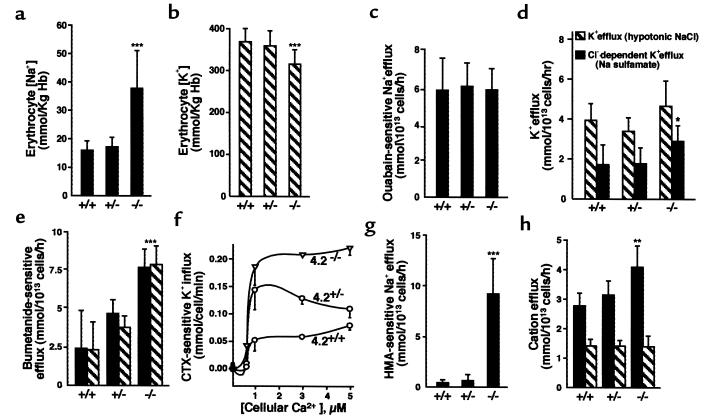
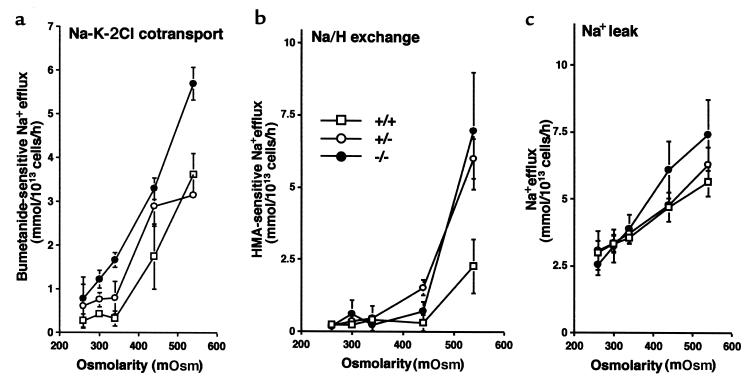
Protein 4.2 is a major component of the red blood cell (RBC) membrane skeleton. We used targeted mutagenesis in embryonic stem (ES) cells to elucidate protein 4.2 functions in vivo. Protein 4. 2-null (4.2(-/-)) mice have mild hereditary spherocytosis (HS). Scanning electron microscopy and ektacytometry confirm loss of membrane surface in 4.2(-/-) RBCs. The membrane skeleton architecture is intact, and the spectrin and ankyrin content of 4. 2(-/-) RBCs are normal. Band 3 and band 3-mediated anion transport are decreased. Protein 4.2(-/-) RBCs show altered cation content (increased K+/decreased Na+)resulting in dehydration. The passive Na+ permeability and the activities of the Na-K-2Cl and K-Cl cotransporters, the Na/H exchanger, and the Gardos channel in 4. 2(-/-) RBCs are significantly increased. Protein 4.2(-/-) RBCs demonstrate an abnormal regulation of cation transport by cell volume. Cell shrinkage induces a greater activation of Na/H exchange and Na-K-2Cl cotransport in 4.2(-/-) RBCs compared with controls. The increased passive Na+ permeability of 4.2(-/-) RBCs is also dependent on cell shrinkage. We conclude that protein 4.2 is important in the maintenance of normal surface area in RBCs and for normal RBC cation transport.


Figures

Figure 1
Figure 1
Epb4.2 gene targeting results in a null mutation. (a) Restriction map of the Epb4.2 locus with the targeted allele shown below. Numbered boxes represent exons. Upon homologous recombination in ES cells, a neomycin-resistant cassette (hatched box) replaced a segment of the gene extending from intron 3 to exon 8. A 667-bp 5′-flanking KpnI-NsiI fragment (filled bar) was used as the hybridization probe to distinguish alleles by Southern blot analysis. Kp, KpnI. Ns, NsiI. Xb, XbaI. Ec, EcoRI. Inset: Southern blot analysis. Homologous recombination occurred in 6 of 114 clones, as indicated by the presence of both the wild-type (18.5 kb) and targeted (14.9 kb) alleles in KpnI-digested DNA. (b) SDS-PAGE analysis (Fairbanks’ method) of RBC membranes (5 μg protein per lane). Protein 4.2 is undetectable and band 3 decreased in 4.2–/– RBCs. (c) Immunoblot analysis of RBC membrane ghosts (left; 5 μg protein per lane) and whole-cell lysates (right; 2.5 μL packed cells per lane). The blots were probed with a polyclonal antibody raised against purified human erythrocyte 4.2 (19). (d) Northern blot analysis of reticulocyte RNA from newborn mice (5 μg per lane). The filters were probed with a 2.4-kb mouse protein 4.2 cDNA (1). (e) Immunoblot of whole-platelet lysates probed with 4.2 antisera, as in c. Lane 1, 1.0 μg normal RBC membranes; lane 2, 3.0 μg normal platelet lysate; lane 3, 6.0 μg 4.2–/– platelet lysate. (f) RNase protection assay of kidney mRNA. Perfused kidney mRNA (10 μg per lane) was hybridized with a 295-bp 32P-labeled riboprobe corresponding to nucleotides 726–1019 (1) within the targeted region of protein 4.2 cDNA. In the left, middle, and right panels, RNase dilutions of 1:200, 1:100, and 1:50 were used, respectively. C is the RNA-free control lane. Sp, spectrin. Ank, ankyrin. bd 3, band 3. 4.1, protein 4.1. 4.2, protein 4.2. RBC, red blood cell ghost membranes. PLT, whole-platelet lysates.
Figure 2
Figure 2
Protein 4.2–/– mice are mildly anemic. (a) RBC volume and hemoglobin concentration histograms obtained by automated analysis of normal (4.2+/+) and mutant (4.2–/–) whole blood. A population of small (left-shifted volume distribution in 4.2–/–; bottom left) and dehydrated (right-shifted distribution in 4.2–/–; bottom right) RBCs are present in 4.2–/– whole blood compared with controls. (b–d) Scanning electron microscopy. Representative photomicrographs of normal (b), heterozygous (c), and 4.2–/– (d) RBCs. Note the spherocytic shape of the 4.2–/– cells. Both normal biconcave and partially spherocytic RBCs are seen in 4.2+/– mice. Scale bar: 1 μm. (e and f) Wright-stained peripheral blood smears from normal (e) and 4.2–/– (f) mice. Note the presence of spherocytes in 4.2-deficient mice and the lack of fragmented cells. Scale bar: 10 μM. (g and h) Accumulation of iron in 4.2–/– spleen (h) is increased compared with wild-type (g). Scale bar: 10 μm. (i) Osmotic gradient ektacytometry. Representative osmotic deformability profiles of RBCs from wild-type (+/+), heterozygous (+/–), and homozygous (–/–) protein 4.2–deficient mice.
Figure 3
Figure 3
Partial band 3 deficiency in 4.2–/– RBCs. (a) Western blots demonstrating immunoreactive α- and β-spectrin (Sp; top 2 arrows, respectively), band 3 (Bd 3), ankyrin (Ank), protein 4.1 (4.1), p55, and glycophorin C (GPC) in normal (+/+) and 4.2-null (–/–) RBC membrane ghosts. p55 and GPC were detected using chemiluminescence; Sp, Bd 3, Ank, and protein 4.1 were detected using alkaline phosphatase–labeled secondary antibody. Each lane contains either equivalent amounts of ghost proteins (5 μg: bd 3 and 4.1; 20 μg: p55 and GPC) or cells (5 × 10⁷ total cells: Sp and Ank). Note the decrement in band 3 in null (–/–) vs. normal (+/+) RBC membrane ghosts. (b) The maximal inhibitory DIDS concentration in 4.2–/– RBCs is decreased to ∼70% of 4.2+/+, confirming reduction of band 3. (c) Red blood cell anion transport. DIDS-sensitive sulfate transport (X ± SEM) in 4.2–/– and 4.2+/– RBCs is decreased to ∼ 60% and ∼80%, respectively, of 4.2+/+ RBCs. *P < 0.05 vs. 4.2+/+. **P < 0.01 vs. 4.2+/+.
Figure 4
Figure 4
Ultrastructure of RBC membrane skeletons. (a and b) Negatively stained, spread membrane skeletons from normal (a) and protein 4.2–/– (b) RBCs. Sp, spectrin filament. JC, junctional complexes. Ank, ankyrin. Scale bar: 100 nm. (c) Triton X-100–extracted RBC membranes. Ten micrograms of normal (+/+), heterozygous (+/–), and 4.2-null (–/–) RBC ghost membranes was extracted in 0.1, 0.5, or 1.0% Triton X-100. The pellet and supernatant (sup) fractions were resolved on a 3.5–17% Fairbanks gradient gel and stained with Coomassie blue. Sp, spectrin. Ank, ankyrin. bd 3, band 3. 4.1, protein 4.1. 4.2, protein 4.2. (d–f) IMPs in normal (d), band 3–null (e), and 4.2-null (f) RBCs. Note the presence of enlarged particle-free areas in band 3– and 4.2-null RBCs. Scale bar: 100 nm.
Figure 5
Figure 5
Cation content and transporter activities of 4.2-deficient RBCs. Na+ (a) and K+ (b) content of RBCs. The Na+ content is significantly increased and the K+ content is significantly decreased in 4.2-null (–/–) RBCs compared with normal (+/+) RBCs. (c) Maximal activity of the RBC Na-K pump. (d) Chloride-dependent K-Cl cotransporter activity. Hatched bars show K efflux in the presence of 260 mOsm NaCl. Filled bars show Cl-dependent K+ efflux (difference between efflux in NaCl and Na sulfamate media, 260 mOsm). (e) Bumetanide-sensitive Na-K-2Cl cotransporter activity. (f) Gardos channel activity. (g) Amiloride-sensitive Na/H exchanger activity. (h) Passive permeability for Na+ and K+ in the presence of 1 mM ouabain, 10 μM bumetanide, and 10 μM amiloride. Filled bars, Na+ efflux. Hatched bars, K+ efflux. The observed changes in Na-K-2Cl cotransporter and Na/H exchanger rates account for the majority of the cation concentration differences seen in 4.2–/– cells. All values X ± SD. *P < 0.05 vs. 4.2+/+. **P < 0.01 vs. 4.2+/+. ***P < 0.001 vs. 4.2+/+.
Figure 6
Figure 6
Effect of cell shrinkage on cation transport in 4.2-deficient RBCs. Influence of cell volume on the activities of Na-K-2Cl cotransport (a), Na/H exchange (b), and Na+ passive permeability (c).
Figure 7
Figure 7
PKC isozyme levels and phosphorylation of membrane skeleton proteins in 4.2–/– RBCs. (a) Western blots of PKC isozymes in RBCs. Each lane contains equivalent amounts of cytosolic protein from 4.2-null (–/–) and normal (+/+) RBCs. Left, PKC-α; middle, PKC-βI; right, PKC-βII. (b) Basal and PMA-stimulated phosphorylation of RBC membrane skeleton proteins in normal and protein 4.2–deficient RBCs. Sp/Ank, spectrin and ankyrin. Add, adducin. 4.1, protein 4.1. 4.9, protein 4.9.

References

    1. Korsgren C, Cohen CM. cDNA sequence, gene structure, and properties of murine pallidin (band 4.2), the protein implicated in the murine pallid mutation. Genomics. 1994;21:478–485. - PubMed
    1. Lux, S.E., and Palek, J. 1995. Disorders of the red cell membrane. In Blood: principles and practice of hematology. R.I. Handin, S.E. Lux, and T.P. Stossel, editors. J.B. Lippincott. Philadelphia, PA. 1701–1818.
    1. Yawata Y. Red cell membrane protein band 4.2: phenotypic, genetic and electron microscopic aspects. Biochim Biophys Acta. 1994;1204:131–148. - PubMed
    1. Korsgren C, Cohen CM. Associations of human erythrocyte protein 4.2. Binding to ankyrin and to the cytoplasmic domain of band 3. J Biol Chem. 1988;263:10212–10218. - PubMed
    1. Golan DE, et al. Control of band 3 lateral and rotational mobility by band 4.2 in intact erythrocytes: release of band 3 oligomers from low-affinity binding sites. Biophys J. 1996;70:1534–1542. - PMC - PubMed

Publication types

MeSH terms