. 1999 Jun 7;189(11):1715-22.
doi: 10.1084/jem.189.11.1715.

Immunoglobulin-binding sites of human FcalphaRI (CD89) and bovine Fcgamma2R are located in their membrane-distal extracellular domains

Affiliations

Immunoglobulin-binding sites of human FcalphaRI (CD89) and bovine Fcgamma2R are located in their membrane-distal extracellular domains

H C Morton et al. J Exp Med. .

Abstract

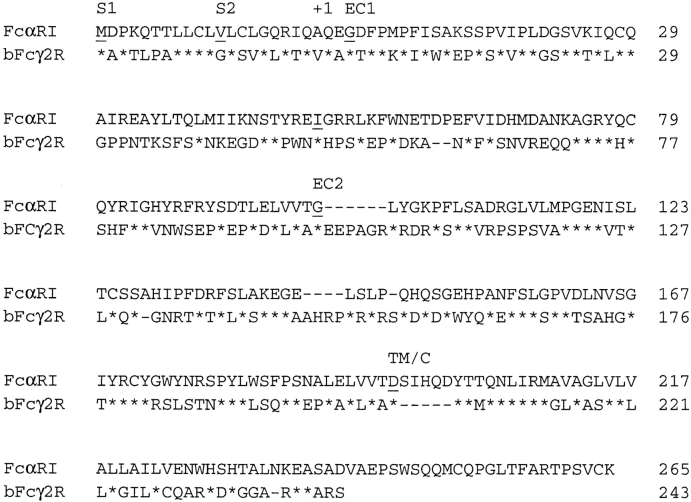
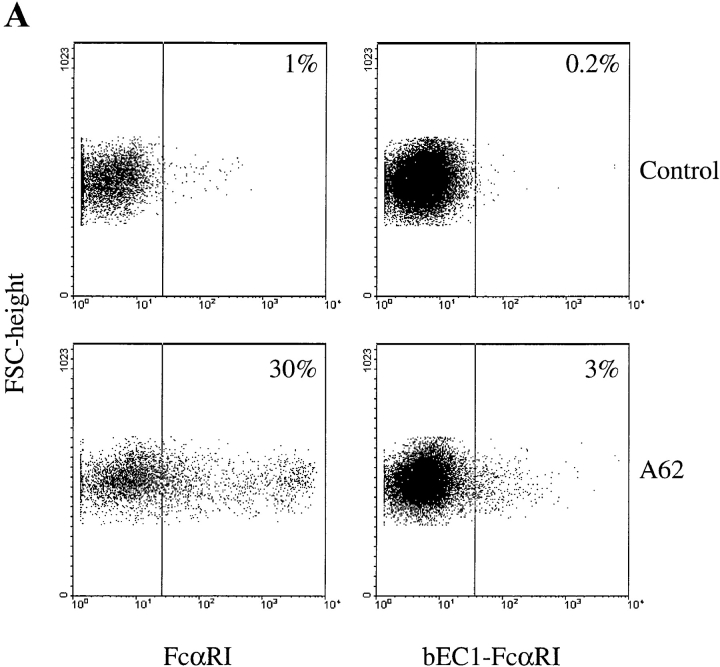
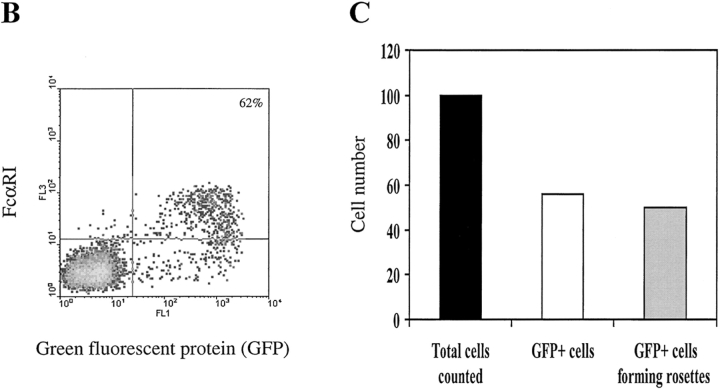
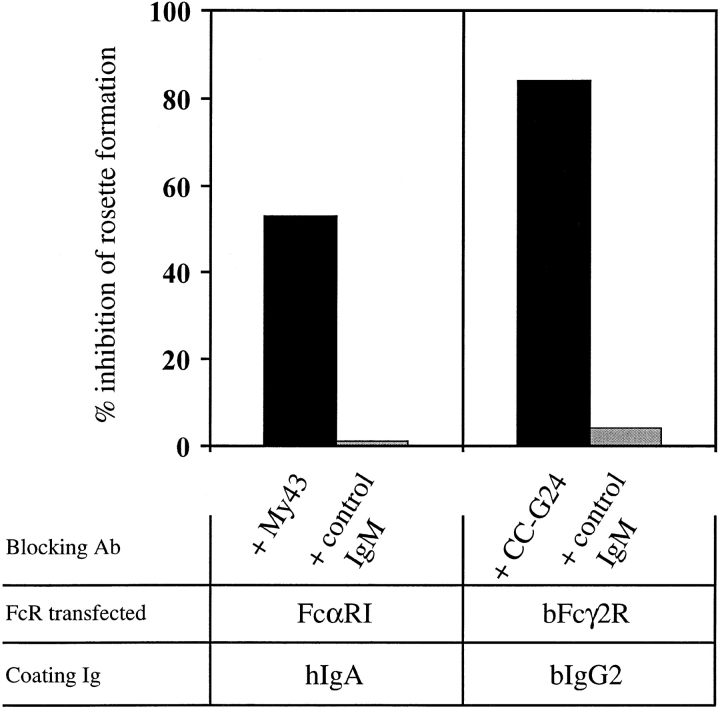
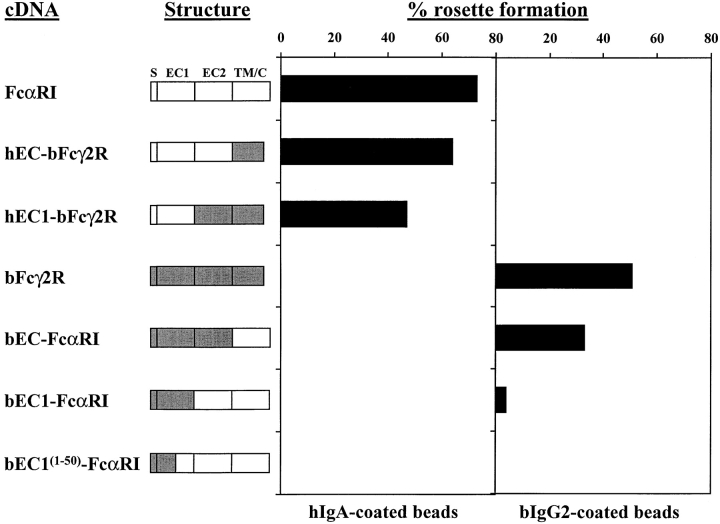
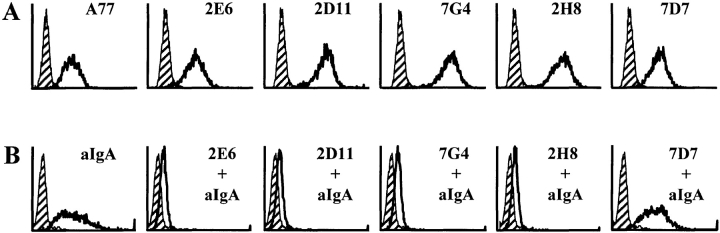
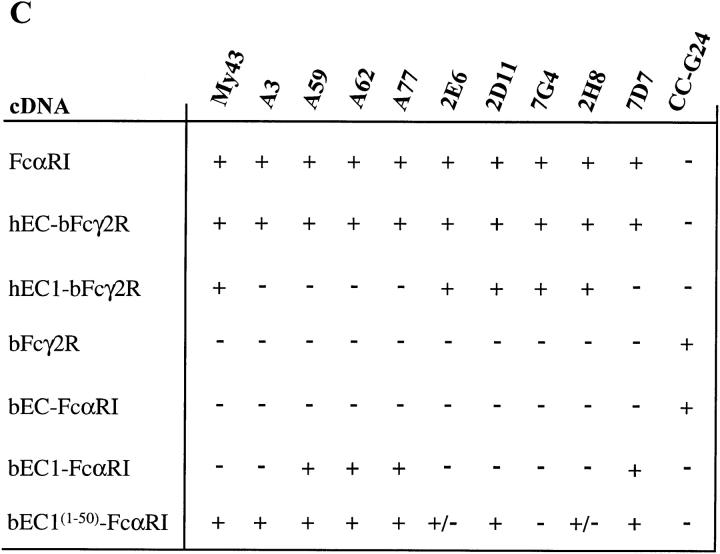
To localize the immunoglobulin (Ig)-binding regions of the human Fcalpha receptor (FcalphaRI, CD89) and the bovine Fcgamma2 receptor (bFcgamma2R), chimeric receptors were generated by exchanging comparable regions between these two proteins. FcalphaRI and bFcgamma2R are highly homologous and are more closely related to each other than to other human and bovine FcRs. Nevertheless, they are functionally distinct in that FcalphaRI binds human IgA (hIgA) but not bovine IgG2 (bIgG2), whereas bFcgamma2R binds bIgG2 but not hIgA. FcalphaRI and bFcgamma2R possess extracellular regions consisting of two Ig-like domains, a membrane-distal extracellular domain (EC1), a membrane-proximal EC domain (EC2), a transmembrane region, and a short cytoplasmic tail. Chimeras constructed by exchanging complete domains between these two receptors were transfected to COS-1 cells and assayed for their ability to bind hIgA- or bIgG2-coated beads. The results showed that the Ig-binding site of both FcalphaRI and bFcgamma2R is located within EC1. Supporting this observation, monoclonal antibodies that blocked IgA binding to FcalphaRI were found to recognize epitopes located in this domain. In terms of FcR-Ig interactions characterized thus far, this location is unique and surprising because it has been shown previously that leukocyte FcgammaRs and FcepsilonRI bind Ig via sites principally located in their EC2 domains.


Figures

Figure 1
Figure 1
Alignment of amino acid sequences of FcαRI (X54150) and bFcγ2R (Z37506). S1 exons are shown from the methionine initiation codons. Because the gene structure of bFcγ2R is unknown, intron–exon boundaries are shown only for FcαRI. Amino acids that link two FcαRI exons are underlined, and the exon designation is shown above the sequence. Note that exon-linking amino acids are conserved between FcαRI and bFcγ2R. The first 19 amino acids of both sequences are considered to represent NH2-terminal signal peptides, which are removed before cell surface expression. Thus, glutamine (Q) 22 is proposed to be the first amino acid of both mature proteins and therefore is designated +1. Isoleucine (I) 50 is also underlined. Residues of bFcγ2R identical to those of FcαRI are designated (*), and gaps that have been inserted to line up the sequences are designated (–) (also see reference 7).
Figure 2
Figure 2
Expression of chimeric FcR by COS-1 cells. (A) Cos-1 cells were transfected with the indicated constructs 2 d before harvesting and FACS® analysis. Cells were stained with either FcαRI EC2-specific mAb A62 (mouse IgG1) (bottom panels) or an appropriate isotype control (top panels), followed by a GAM IgG1 Tricolor reagent. Numbers in the top right corners of the plots refer to the percentage of positive cells. (B) Enrichment of FcαRI expression in COS-1 cells cotransfected with GFP. Cells transfected with both FcαRI and GFP were stained with FcαRI EC2-specific mAb A62 followed by GAM IgG1 Tricolor reagent and analyzed by FACS®. More than 60% of the GFP+ cells also express FcαRI. (C) Rosette formation by COS-1 cells cotransfected with both FcαRI and GFP and exposed to hIgA-coated beads. Rosettes were quantified as specified in Materials and Methods. Black bar, total number of cells counted; white bar, total number of GFP+ cells assessed by fluorescent microscopy; gray bar, number of GFP+ cells forming rosettes. Results shown are representative of three separate experiments.
Figure 2
Figure 2
Expression of chimeric FcR by COS-1 cells. (A) Cos-1 cells were transfected with the indicated constructs 2 d before harvesting and FACS® analysis. Cells were stained with either FcαRI EC2-specific mAb A62 (mouse IgG1) (bottom panels) or an appropriate isotype control (top panels), followed by a GAM IgG1 Tricolor reagent. Numbers in the top right corners of the plots refer to the percentage of positive cells. (B) Enrichment of FcαRI expression in COS-1 cells cotransfected with GFP. Cells transfected with both FcαRI and GFP were stained with FcαRI EC2-specific mAb A62 followed by GAM IgG1 Tricolor reagent and analyzed by FACS®. More than 60% of the GFP+ cells also express FcαRI. (C) Rosette formation by COS-1 cells cotransfected with both FcαRI and GFP and exposed to hIgA-coated beads. Rosettes were quantified as specified in Materials and Methods. Black bar, total number of cells counted; white bar, total number of GFP+ cells assessed by fluorescent microscopy; gray bar, number of GFP+ cells forming rosettes. Results shown are representative of three separate experiments.
Figure 3
Figure 3
Specificity of the bead rosetting assays. COS-1 cells were cotransfected with the indicated FcR construct together with pCMV-GFP. GFP+ cells were purified as described in Materials and Methods and incubated with the relevant murine IgM-blocking mAb or an irrelevant murine IgM control mAb for 30 min before addition of Ig-coated beads. Results are shown as percentage of inhibition of rosette formation when compared with transfectants that were not incubated with mAb before rosetting analysis. Results shown are representative of two experiments.
Figure 4
Figure 4
Rosette formation by FcR/GFP cotransfected COS-1 cells. Schematic representation of wild-type and chimeric FcRs. Unshaded regions are derived from FcαRI, shaded regions from bFcγ2R. S, signal peptide; EC1, extracellular domain 1; EC2, extracellular domain 2; TM/C, transmembrane/cytoplasmic tail. GFP+ transfectants were purified from COS-1 cells cotransfected with GFP and FcR constructs as described. Ig-binding to FcRs coexpressed with GFP was assessed by rosetting with either hIgA- or bIgG2-coated beads. More than 200 cells were counted for each determination, and the number of cells binding four or more Ig-coated beads is expressed as percentage rosette formation. Results are representative of three separate experiments.
Figure 5
Figure 5
(A) FACS® analysis of newly produced mAbs to FcαRI compared with mAb A77 of similar specificity. FcαRI-expressing murine B cells (IIA1.6) were incubated with mAbs as indicated (white peaks) or with concentration and isotype-matched control mAbs (hatched peaks), followed by a GAM IgG1–PE conjugate. (B) FcαRI-expressing IIA1.6 cells were incubated without (left panel) or with mAbs as indicated, followed by heat-aggregated hIgA (aIgA). After 1 h at 4°C, cells were washed and bound hIgA was detected by incubation with goat anti–human IgA F(ab)2-PE conjugate (white peaks). Cells incubated with only the secondary reagent served as negative controls (hatched peaks). (C) Reactivity of chimeras (left) with a panel of FcαR and bFcγ2R mAb (top) as measured by FACS® analysis. Binding was graded as follows: +, strong binding; +/−, weak binding; −, no binding.
Figure 5
Figure 5
(A) FACS® analysis of newly produced mAbs to FcαRI compared with mAb A77 of similar specificity. FcαRI-expressing murine B cells (IIA1.6) were incubated with mAbs as indicated (white peaks) or with concentration and isotype-matched control mAbs (hatched peaks), followed by a GAM IgG1–PE conjugate. (B) FcαRI-expressing IIA1.6 cells were incubated without (left panel) or with mAbs as indicated, followed by heat-aggregated hIgA (aIgA). After 1 h at 4°C, cells were washed and bound hIgA was detected by incubation with goat anti–human IgA F(ab)2-PE conjugate (white peaks). Cells incubated with only the secondary reagent served as negative controls (hatched peaks). (C) Reactivity of chimeras (left) with a panel of FcαR and bFcγ2R mAb (top) as measured by FACS® analysis. Binding was graded as follows: +, strong binding; +/−, weak binding; −, no binding.

Similar articles

Cited by

References

    1. Ravetch JV, Kinet JP. Fc receptors. Annu Rev Immunol. 1991;9:457–492. - PubMed
    1. Daeron M. Fc receptor biology. Annu Rev Immunol. 1997;15:203–234. - PubMed
    1. Morton HC, van Egmond M, van de Winkel JG. Structure and function of human IgA Fc receptors (FcαR) Crit Rev Immunol. 1996;16:423–440. - PubMed
    1. Shen L. Receptors for IgA on phagocytic cells. Immunol Res. 1992;11:273–282. - PubMed
    1. Monteiro RC, Kubagawa H, Cooper MD. Cellular distribution, regulation, and biochemical nature of an Fcα receptor in humans. J Exp Med. 1990;171:597–613. - PMC - PubMed

MeSH terms