

Vibro-acoustography: an imaging modality based on ultrasound-stimulated acoustic emission
- PMID: 10359758
- PMCID: PMC21961
- DOI: 10.1073/pnas.96.12.6603
Vibro-acoustography: an imaging modality based on ultrasound-stimulated acoustic emission
Abstract
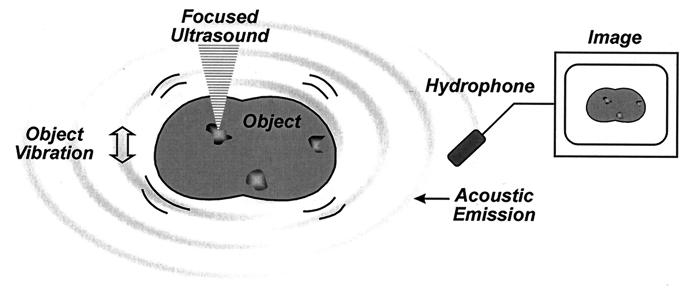
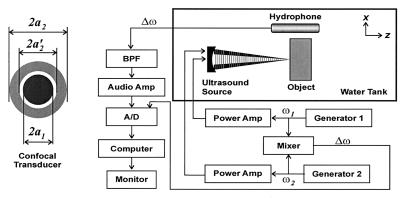
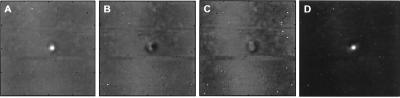
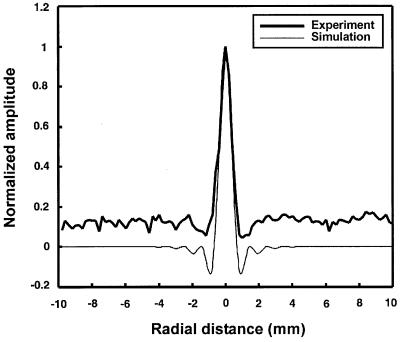
We describe theoretical principles of an imaging modality that uses the acoustic response of an object to a highly localized dynamic radiation force of an ultrasound field. In this method, named ultrasound-stimulated vibro-acoustography (USVA), ultrasound is used to exert a low-frequency (in kHz range) force on the object. In response, a portion of the object vibrates sinusoidally in a pattern determined by its viscoelastic properties. The acoustic emission field resulting from object vibration is detected and used to form an image that represents both the ultrasonic and low-frequency (kHz range) mechanical characteristics of the object. We report the relation between the emitted acoustic field and the incident ultrasonic pressure field in terms of object parameters. Also, we present the point-spread function of the imaging system. The experimental images in this report have a resolution of about 700 microm, high contrast, and high signal-to-noise ratio. USVA is sensitive enough to detect object motions on the order of nanometers. Possible applications include medical imaging and material evaluation.
Figures
References
-
- Maynard J. Phys Today. 1996;49(1):26–31.
-
- O’Donnell M, Skovoroda A R, Shapo B M, Emelianov S Y. IEEE Trans Ultrason Ferroelectr Freq Contr. 1994;41:314–325.
-
- Ophir J, Cespedes I, Ponnenkanti H, Yazdi Y, Li X. Ultrason Imaging. 1991;13:111–134. - PubMed
-
- Yamakoshi Y, Sato J, Sato T. IEEE Trans Ultrason Ferroelectr Freq Contr. 1990;47:45–53. - PubMed
-
- Krouskop T A, Dougherty D R, Vinson F S. J Rehabil Res Dev. 1987;24:1–8. - PubMed
LinkOut - more resources
Full Text Sources
Other Literature Sources
