. 1999 Jun 8;96(12):6648-53.
doi: 10.1073/pnas.96.12.6648.

Feedback control of a master bacterial cell-cycle regulator

Affiliations

Feedback control of a master bacterial cell-cycle regulator

I J Domian et al. Proc Natl Acad Sci U S A. .

Abstract

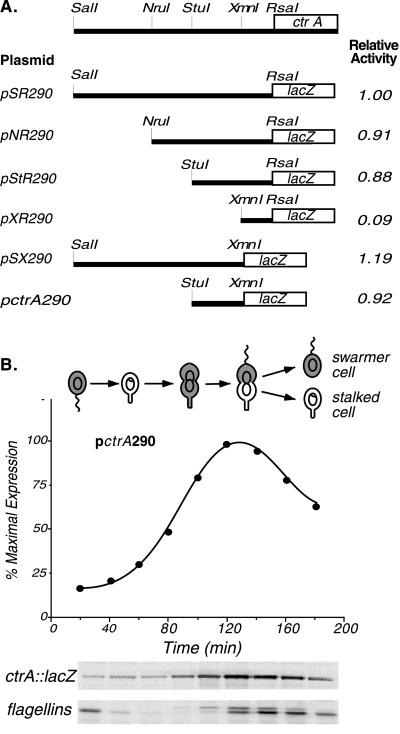
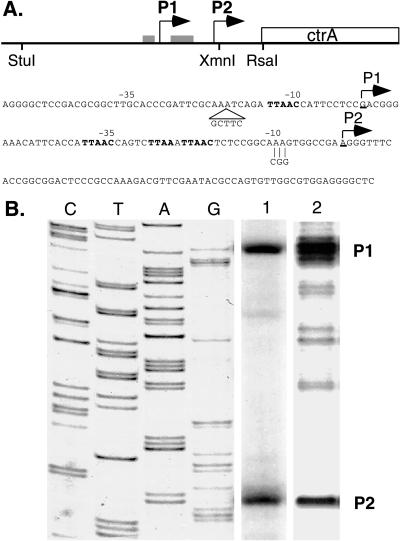
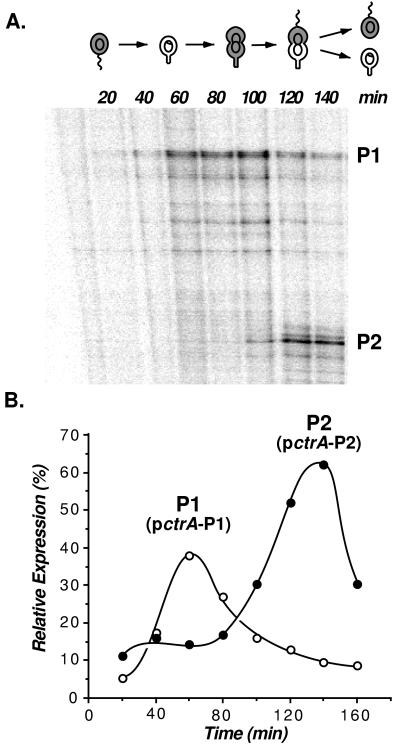
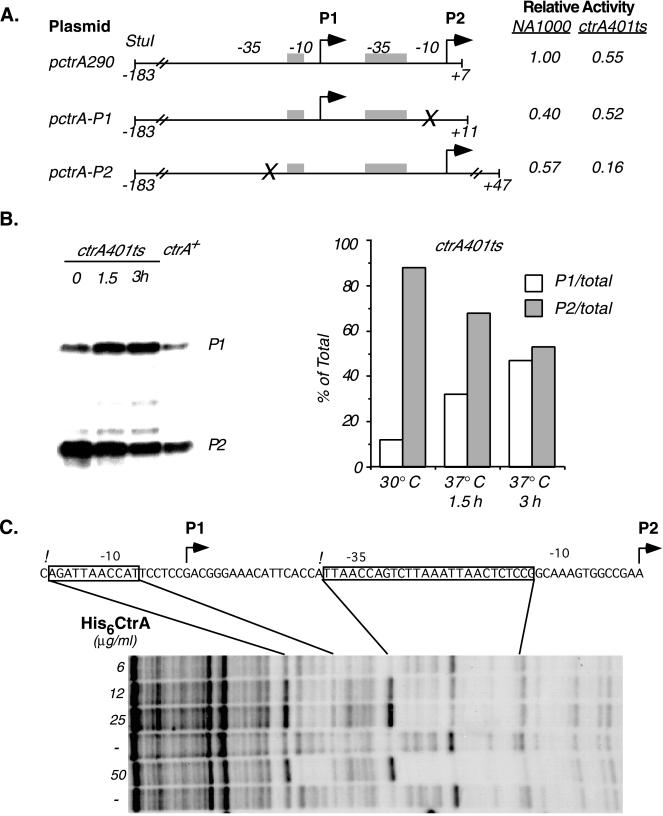
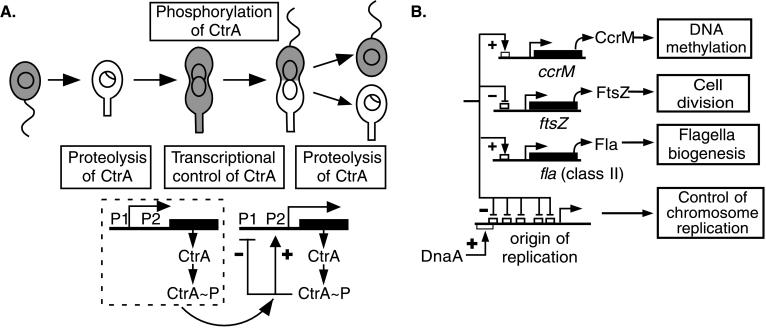
The transcriptional regulator CtrA controls several key cell-cycle events in Caulobacter crescentus, including the initiation of DNA replication, DNA methylation, cell division, and flagellar biogenesis. CtrA is a member of the response regulator family of two component signal transduction systems. Caulobacter goes to great lengths to control the time and place of the activity of this critical regulatory factor during the cell cycle. These controls include temporally regulated transcription and phosphorylation and spatially restricted proteolysis. We report here that ctrA expression is under the control of two promoters: a promoter (P1) that is active only in the early predivisional cell and a stronger promoter (P2) that is active in the late predivisional cell. Both promoters exhibit CtrA-mediated feedback regulation: the early P1 promoter is negatively controlled by CtrA, and the late P2 promoter is under positive feedback control. The CtrA protein footprints conserved binding sites within the P1 and P2 promoters. We propose that the P1 promoter is activated after the initiation of DNA replication in the early predivisional cell. The ensuing accumulation of CtrA results in the activation of the P2 promoter and the repression of the P1 promoter late in the cell cycle. Thus, two transcriptional feedback loops coupled to cell cycle-regulated proteolysis and phosphorylation of the CtrA protein result in the pattern of CtrA activity required for the temporal and spatial control of multiple cell-cycle events.


Figures

Figure 1
Figure 1
(A) Deletion analysis to define the functional ctrA promoter region. Fragments of the region upstream of ctrA were fused to a promoterless lacZ reporter in pRKlac290. β-Galactosidase activity (16) was measured in mid-log phase wild-type cultures bearing the plasmids shown. The activity of pSR290, defined here as 1.0, was 7,560 Miller units. The ctrA promoter was localized to a 190-bp StuI to XmnI fragment (pctrA290). (B) Temporal expression of the ctrA promoter. The Caulobacter cell cycle is shown schematically. The gray shading marks the presence of CtrA. The theta and ring structures within the cells represent replicating DNA and nonreplicating DNA, respectively. As wild-type cells bearing pctrA290 progressed through the cell cycle, samples were pulse labeled with [35S]methionine at the indicated times, and β-galactosidase and flagellin synthesis was assessed by immunoprecipitation. Labeled proteins were separated by gel electrophoresis (Lower). The pctrA290 activity was quantitated with a PhosphorImager and is shown as a function of the cell cycle. Flagellin synthesis was assayed as an internal control for cell-cycle progression.
Figure 2
Figure 2
Identification of ctrA transcription start sites. (A) The diagram shows the location of the P1 and P2 ctrA transcription start sites (bent arrows) and CtrA recognition motifs (gray boxes) relative to the ctrA gene. The −10 and −35 regions of the two promoters are marked above the nucleotide sequence. CtrA recognition motifs and the translation start site are in bold. Individual mutations generated in the P1 promoter (5-bp insert in pctrA-P2) and the P2 promoter (3-bp substitution in pctrA-P1) are indicated. (B) Primer extension and S1 nuclease mapping of the ctrA transcription start sites. The first four lanes show a sequencing ladder generated by using a primer with the same 5′ end as the primer extension primer and the S1 probe. Two transcription start sites were detected. The products common to primer extension (lane 1) and S1 nuclease protection (lane 2) are labeled P1 and P2.
Figure 3
Figure 3
Temporal expression of the ctrA P1 and P2 promoters. (A) RNase protection analysis. Total cellular RNA was isolated from synchronous wild-type cultures at 20-min intervals. RNase protection assays were performed by using a [32P]dCTP labeled cRNA probe complementary to the ctrA promoter region. Protected RNAs were resolved on a sequencing gel and visualized with a PhosphorImager. The P1 and P2 transcripts are labeled. (B) Expression of pctrA-P1 (o) and pctrA-P2 (●) (diagrammed in Fig. 4A) fused to a promoterless lacZ gene were used to monitor transcription as a function of the cell cycle, as described in the legend to Fig. 1. The relative expression of the two promoters was based on the β-galactosidase activity of pctrA-P1 and pctrA-P2 (3,940 and 6,280 Miller units, respectively).
Figure 4
Figure 4
The CtrA protein controls its own transcription. (A) Promoter activity of wild-type and mutant ctrA promoters. The activity of the wild-type promoter containing both P1 and P2 (plasmid pctrA290) and constructs containing either P1 or P2 activity alone was measured in wild-type cells and in a strain bearing a ctrA401ts allele. Plasmid pctrA-P1 was generated by site-directed mutagenesis of the −10 region of P2 (marked by the X). In pctrA-P2, the P1 promoter was disrupted by inserting 5 bp at −20 (see Fig. 2A). β-Galactosidase activity was measured in wild-type and ctrA401ts cultures after 3 hr at 37°C. Transcription of pctrA-P1 and pctrA-P2 was normalized to pctrA290 activity in the wild-type strain. Values are the average of three determinations. (B) S1 nuclease protection analysis of the P1 and P2 transcripts. Total cellular RNA was isolated from wild-type cultures and cultures containing the ctrA401ts allele grown at 30°C or at 37°C (the restrictive temperature) for 1.5 and 3 h. The P1 and P2 transcripts were resolved on denaturing acrylamide gels. [32P]-labeled DNA standards were used to identify the P1 and P2 transcripts. (Right) Relative levels of the P1 and P2 transcripts, quantitated by using a PhosphorImager, in the mutant background. Data are expressed as the percent of total (P1 + P2) transcripts in each lane. (C) DNase I protection of the ctrA promoter with purified His6-CtrA. His6-CtrA concentrations in each footprinting reaction are indicated. The sequence of the coding strand is shown. Regions protected by His6-CtrA are boxed, the P1 and P2 start sites are marked by bent arrows, and hypersensitive sites are indicated by exclamation marks.
Figure 5
Figure 5
(A) Schematic of feedback regulation of ctrA transcription during the cell cycle. Shaded areas in the cells indicate the presence of CtrA. The times of CtrA proteolysis and CtrA phosphorylation (13) are indicated. After threshold levels of CtrA≈P accumulate in the predivisional cell, the P1 promoter is repressed, and the P2 promoter is activated by CtrA≈P binding to recognition motifs in these promoters. (B) The regulatory network controlled by CtrA≈P.

References

    1. Shapiro L, Losick R. Science. 1997;276:712–718. - PubMed
    1. Degnen S, Newton A. J Mol Biol. 1972;64:671–680. - PubMed
    1. Marczynski G T, Lentine K, Shapiro L. Genes Dev. 1995;9:1543–1557. - PubMed
    1. Quon K C, Yang B, Domian I J, Shapiro L, Marczynski G T. Proc Natl Acad Sci USA. 1998;95:120–125. - PMC - PubMed
    1. Roberts C R, Mohr C D, Shapiro L. Curr Top Dev Biol. 1996;34:207–257. - PubMed

Publication types

LinkOut - more resources